2019

Businesses @ Work

Welcome to the fifth Businesses @ Work report, an in-depth look into how organizations and people work today — exploring workforces and customers, and the applications and services they use to be productive.

Technology portfolios are like fingerprints: no two organizations use the exact same apps and services the same way. Data from the Okta Integration Network — which includes over 7.000+ integrations with cloud, mobile and web apps, and IT infrastructure providers — shows that companies around the world are choosing technologies that prioritize interoperability, automation, and offer a broad range of functionality. What stands out this year? The fastest-of-the-fastest growing apps focus on identity-driven security, indicating that companies are taking Zero Trust seriously. We also see the impressive power of network effects, explore how the most popular apps keep growing, and dive into how workers feel about them. At the same time, like modern-day Darwins, we’re watching evolution before our eyes, seeing companies connect “cloud-to-ground,” continuing to protect on-premises infrastructure even as they move to the cloud.

How Did Okta Create This Report?

To create all our Businesses @ Work reports, we anonymize Okta customer data from our network of thousands of companies, applications, and IT infrastructure integrations, and millions of daily authentications and verifications from countries around the world. Our customers and their employees, contractors, partners, and customers use Okta to log in to devices, apps and services, and leverage security features to protect their sensitive data. Our customers span every major industry and vary in size, from small businesses to enterprises with hundreds of thousands of employees or millions of customers. As you read this report, keep in mind that this data is representative of Okta's customers, the applications we connect to, and the ways in which users access these applications through our service.

We have worked carefully to standardize our data. Unless otherwise noted, this report presents and analyzes data from November 1, 2017 to October 31, 2018, which we refer to as “this year,” “today,” and “in 2018.” Similarly, when we refer to “last year” or “in 2017,” we are referring to data from November 1, 2016 to October 31, 2017. “2016” refers to the same period in its respective year.

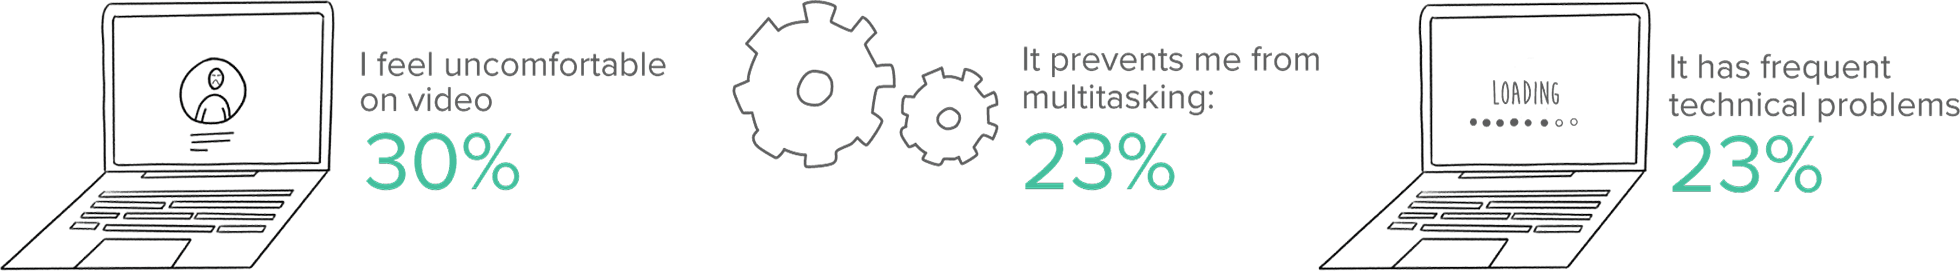
This year, in addition to reporting on popular apps and systems across Okta’s network, we also added the results of a survey of knowledge workers about their workplace preferences, which adds further insight to our proprietary findings. Commissioned by Okta, Qualtrics conducted a survey of over 1,200 U.S. knowledge workers from companies of various sizes, across many industries. Responses were collected in December 2018 and January 2019. We refer to this survey of knowledge workers as “our survey” and “survey,” and refer to the workers who responded as “survey respondents.”

Most Popular Apps of 2018

The fastest growing apps

User-focused security apps dominate the fastest growing apps with KnowBe4, LastPass, and Proofpoint in the top three spots. KnowBe4 in particular is fulfilling a clear market need: less than half of survey respondents have ever participated in cybersecurity training at work. We also looked at customers with complex hybrid IT environments to see how they integrate with application and security network vendors to allow end users access across cloud and on-prem apps. We discovered that a growing number of Okta customers are integrating with networking systems. The most popular choice is Palo Alto Networks, which surpassed Citrix this past year. And looking across the pond, the fastest-growing app with a European HQ is Mimecast.

See the Data
Companies have a growing app-etite

There’s a clear trend that larger companies are deploying more apps over time. Large companies (2,000 or more employees) who have been with Okta for three years are deploying 163 apps on average. And in the past four years, large customers have increased their number of deployed apps by 68%.

We also looked at whether companies who invest in the Office 365 suite — the top app in our network — end up committing to a Microsoft-only environment, and the answer was clearly “no.” We found that 76% of Okta’s Office 365 customers have one or more apps that are duplicative of apps offered by Microsoft. Over 28% are chatting on Slack. Nearly 24% are connecting with their colleagues on Zoom. And over 28% of Okta’s Office 365 customers are “double bundling” themselves, subscribing to G Suite as well. Looking at the total number of customers who leverage Okta for workforce identity, we see a smaller proportion of customers using Active Directory, from a high of over 78% in August 2015 to 70% in 2018.

Also noteworthy, companies investing in developer tools are three times as likely to deploy G Suite as are “non-developers” (companies without any developer tools). Our data shows that 46% of companies with at least one developer tool also have G Suite, vs. only 17% of non-developers.

See the Data
The more factors the merrier... and more secure

Nearly 40% of survey respondents told us they reuse the same two to four passwords for almost everything, and 10% reported using just one password. So it’s a good thing more companies are turning to MFA to protect against costly breaches. Most companies — 70%, in fact — are using two to four different factors, up from 65% last year. And 29% of companies are using four or more factors. Individuals are starting to apply this best practice to their personal lives as well: 26% of survey respondents have set MFA up themselves, and another 38% reported using it at work. We also see a slow but steady shift toward more secure factors (app generated codes, push authentication, and physical keys) and away from lower assurance factors like SMS and security questions. The two most commonly used factors are Okta Verify (a mobile app-based factor) and SMS. The number of customers with Okta Verify has increased over the past three years, whereas the number of customers with SMS has dropped.

When we look at organizations that at first adopt less secure factors, such as SMS or security questions, we see many eventually up their game by adding more secure factors, such as a mobile app like Okta Verify, Google Authenticator or Duo, or token-based YubiKey. Over two-thirds of the Okta customers who enrolled since 2016 with less secure factors added more secure factors within two years. After two years, 71% of customers had added Okta Verify and 44% had added Google Authenticator, while 15% had added YubiKey and 5% had added Duo.

See the Data
More companies are mastering HR

Companies are leveraging their HR systems in new ways, and investing in up-and-coming tools. Three of the top 10 apps by number of users are HR-related, with HR systems Workday and SAP SuccessFactors at #2 and #8 respectively. Namely claims the fastest growth by number of customers, with 67% year over year, closely followed by BambooHR at 51% and UltiPro at 50%. Chart-topping Workday has the fifth fastest growth with 28% year over year.

See the Data
Welcome to the planet of the apps

This year we broke out our travel app data into three categories: hotels and lodging, air travel, and ground transportation. In the past year, we’ve seen Airbnb climb from #4 to #2 in the most popular hotel and lodging apps. For the more traditional hotel experience, the Starwood Hotels group (which includes the Westin, Sheraton, and W Hotels) and Marriott lead the pack. Southwest flew into the #1 spot over two years ago and continues to gain altitude. Uber has held the top spot in the ground transportation app race for the past year, and continues to grow.

We’ve seen big shifts in personal banking and finance, news, healthcare, and project management, as well. The Wall Street Journal surpassed CNN as the most popular app for Okta customers, and The New York Times had a burst of growth that moved it into second place. PayPal adoption seemed to be leveling off in 2017, but a jump in adoption in 2018 kept the online payment company at the top of the stack. In healthcare, Teladoc rose from the bottom of the list, shooting up 280% in the past two years to blow past household-name providers such as Aetna, Cigna, and UnitedHealthcare. And in the project management space, Trello has grown 119% over the past two years.

See the Data
People @ Work

In addition to reporting on the popular apps and services across Okta’s network, we wanted to know how average office employees approach their work weeks and the ways technology has changed how they work. To find out, we surveyed over 1,200 knowledge workers in various industries across the United States about their preferred work tools, ideal office environment, and even work-from-home wardrobe selections. The results show that remote work is a popular preference, video conferencing is (still) uncomfortable, there’s a divide on pet-friendly and pet-free offices, and no one is exactly rooting for open floor plans. We also found that 53% of survey respondents like their job and 16% love their job — showing that no matter their work preferences, today’s employees are figuring out how to work happy.

See the Data

Survey says...

Slack and Zoom’s tremendous growth becomes even more impressive when you consider their continued growth potential. According to our survey results, only 16% of knowledge workers have heard of Slack and half of those that heard of it have used it before. Zoom is slightly ahead, with 19% of respondents aware of the app and 9% reporting that they have used it. These numbers may seem small, but when you consider there are more than 60 million knowledge workers in the U.S. alone, that’s quite a dent.

View LegendView Full Screen

Survey Insights: Video Conference App Experience

    • Skype
    • Cisco Webex
    • Zoom

    Incumbents in the video conferencing space have put up a tough fight. (Sound familiar?) Our survey results found that 63% of knowledge workers have used Skype before, and 25% have used Cisco Webex, which takes the 11th spot on our list of most popular apps by monthly active users.

    Zoom has disrupted video conferencing by offering a compelling user interface and experience, but it’s not always sunny in its field. Survey respondents identify Skype as their least favorite and most stressful app out of the entire list. Webex and Zoom both enjoy having fewer detractors among our survey respondents, with 7% of respondents disliking Webex, and only 4% reporting that they dislike Zoom.

    Some apps rank much higher when looking at active unique users than when looking at number of customers. For the second year in a row, wall-to-wall business apps, Workday and ServiceNow, rank as the #2 and #3 most popular apps by active users, while ServiceNow slid into the 15th spot of the most popular apps by number of customers. On the flip side, Zoom ranks #9 in number of customers but does not appear in the top 15 ranking by number of active unique users.

    Fastest Growing Apps

    Don't trust, verify! The fastest growing apps are security tools

    We noticed impressive growth in company investments in security tools. Why? Increased attack sophistication and insider threats mean that not everything or everyone inside a network can be trusted. With the new Zero Trust framework, organizations are shifting the focus of modern security away from traditional network strategies to perimeter-less approaches, focusing on users, data, and locations. People (and their identities) are at the center of this framework – and organizations are looking for tools to help protect those valuable credentials.

    Regulation may also be contributing to the growth of security-focused apps. The General Data Protection Regulation (GDPR), designed to strengthen and unify data privacy laws across Europe, went into effect in May 2018, with the threat of heavy fines for non-compliance, and the California Consumer Privacy Act, which regulates the personal data of residents of the most populous state in the U.S., is slated to take effect in January 2020.

    View LegendView Full Screen

    Fastest Growing Apps

      App Usage Growth Rate - 12 Month Growth

      User-focused security apps dominate the fastest growing apps with KnowBe4, LastPass, and Proofpoint in the top three spots. KnowBe4, a security awareness training company, beat out other apps by far with its 178% year-over-year growth to claim the top spot. KnowBe4’s rapid growth may be due to its fulfillment of a clear market need: an industry report found that nearly half of data breaches are due to employee error, yet only 49% of our survey respondents have ever participated in cybersecurity training at work. The adoption of LastPass, which stores encrypted passwords online, and Proofpoint, an email security and security awareness training provider, each grew over 100%.

      View LegendView Full Screen

      Fastest Growing Apps with European HQ

        App Usage Growth Rate - 12 Month Growth

        Not only are we seeing innovation coming from cloud apps headquartered in the U.S., we’re consistently seeing it in Europe as well. We took a look at the popularity of apps that have corporate headquarters based in Europe, and the fastest growing app is Mimecast. British security company Sophos, German-based TeamViewer, and Swedish Pingdom round out the list.

        Note: Of our customers integrating Okta directly with corporate networks, these are the systems they have deployed. Some customers may deploy more than one vendor.

        In addition to looking at the growth of apps across our network, we were curious to see how customers are integrating with other IT systems. We know customers with complex hybrid IT environments integrate with application and security network vendors to allow end users access across cloud and on-prem apps. We discovered that a growing number of Okta customers are integrating with networking systems. The most popular choice is Palo Alto Networks, which surpassed Citrix this past year. Cisco has also seen strong growth, passing F5.

        Companies Have a Growing App-etite

        Any way you slice it, app use keeps growing over time

        Companies of every size and across all industries find more and more apps “app-ealing”: there’s a clear trend that companies are deploying more apps over time. This year we looked at the average number of apps two ways: first, year-over-year growth, and second, growth across the customer’s relationship with Okta. We broke out our data by large companies (2,000 or more employees) and small/mid-sized companies (under 2,000 employees). From every angle, we saw companies deploying more apps than they did in previous years.

        View LegendView Full Screen

        Average Number of Apps per Customer

          Average Number of Apps

          Note: Data includes Okta Integration Network (OIN) and non-OIN, personal and corporate apps.

          Since 2015, the average number of apps per company has grown by 43%. We see an 8% jump from 2017. Another fun fact: over 9% of customers have more than 200 apps.

          View LegendView Full Screen

          Average Number of Apps over the First Three Years of a Customer Lifetime, by Customer Size

          Average Number of Unique Apps
            Number of Days

            Note: Data includes Okta Integration Network (OIN) and non-OIN, personal and corporate apps deployed. Large customers are defined as those with 2,000 or more employees. Small/mid-sized customers have fewer than 2,000 employees.

            The longer a company has been an Okta customer, the more apps they tend to deploy. Looking at the total number of apps, companies who have been with Okta for one year have on average 52 apps, while at the three-year mark, they average 112 apps — 115% growth over two years.

            We were interested to see how the number of apps deployed by large companies compares with their smaller counterparts. We found that large companies started their journey with a lower average than small/mid-sized companies, but caught up in under six months, then quickly surpassed the adoption average of smaller companies. Three years out, larger companies are deploying 163 apps on average, whereas smaller companies deploy an average of 99.

            View LegendView Full Screen

            Average Number of Apps per Customer, by Customer Size

            • Large
            • Small/mid-sized
              Average Number of Apps

              And what about year-over-year growth? In the past four years, large customers have increased their app usage by 68%, now averaging 129 apps per customer in 2018. Small to mid-sized companies have also dialed up their app usage at a 38% growth rate, now averaging 73 apps per customer.

              Get a double stroller: Office 365 doesn’t roll alone

              When companies adopt their little bundles of joy (we’re talking about bundles of business productivity applications, of course), they may gaze adoringly at their screens for a few moments before shaking their heads and realizing, “This just isn’t cutting it.” So, they expand their “family” with standalone, best-of-breed apps that address their unique needs, or even (gasp), additional bundles.

              Popular office suite bundles from the software juggernauts generally include tools for personal productivity, communication, collaboration, and content management. Choosing a bundled service historically meant organizations sacrificed best-of-breed functionality and the ability to integrate well with unbundled alternatives for a lower price. Not surprisingly, as some of the most cloud-forward organizations, our customers are no longer willing to make that sacrifice. When we looked at whether companies who invest in the Office 365 suite — the top app in our network — end up committing to a Microsoft-only environment, the answer was clearly “no.”

              View LegendView Full Screen

              Percentage of Okta's Office 365 Customers with Best-of-Breed Apps over Time

              • Salesforce*
              • AWS
              • Box
              • G Suite
              • Slack
              • Zoom
                Percentage of Okta Office 365 Customers with App

                Note: Salesforce data for 2017 and 2018 are the same at the time of the report.

                How do we define “best-of-breed”? Best-of-breed apps excel at performing specialized functions, whether or not they are part of an integrated system. We look to our rankings for most popular apps by number of customers and see that Salesforce, AWS, Box, Slack, and Zoom, each representing a different product category, are some of the most popular stand-alone apps, gaining our “best-of-breed” designation.

                We studied our Office 365 customers to see what other apps they are using. We found that 76% have one or more apps that duplicative of apps offered by Microsoft. Over 45% have Salesforce, and 36% are using AWS. Nearly 32% are storing files on Box. Over 28% are chatting on Slack. Nearly 24% are connecting with their colleagues on Zoom. Finally, we found that over 28% of Okta’s Office 365 customers are “double bundling” themselves, subscribing to G Suite as well. It’s clear that these customers are not buying into becoming full “Microsoft shops.”

                View LegendView Full Screen

                Overlap of Okta Customers Using Office 365 and Best-of-Breed Apps

                Percentage of Okta’s Office 365 Customers
                • Best-of-Breed Apps
                • 0 Apps
                • 1 Apps
                • 2 Apps
                • 3 Apps
                • 4 Apps
                • 5 Apps
                • 6 Apps

                  The number of Okta's Office 365 customers who are also choosing to deploy best-of-breed apps is growing steadily over time. In 2015, only 21% of companies were deploying three to six of our top stand-alone apps in addition to Office 365, but in 2018 that number grew to 33%. In 2018, three quarters of all of Okta's Office 365 customers were subscribed to at least one best-of-breed app.

                  Survey says...

                  Best-of-breed apps also tend to be people-pleasers. Our survey asked knowledge workers what they care about the most when it comes to work apps, and ease of use was the overarching theme.

                  View LegendView Full Screen

                  Survey Insights: What Knowledge Workers Want in the App Experience

                    View LegendView Full Screen

                    Percentage of Customers with Active Directory Integrated with Okta

                    Percentage of Customers

                      Note: Customers represented in this data are leveraging workforce identity.

                      Microsoft’s Active Directory, or “AD” for short, has been the preferred on-prem directory services platform in most IT organizations for nearly twenty years. (Back in 2014, it was reported that 95% of the Fortune 500 used AD.) But as IT networks evolve and move to the cloud, AD might not be right for everyone. Looking at customers who leverage Okta for workforce identity, we are seeing a smaller percentage of customers with AD integrated into Okta, from a high of over 78% in August 2015 to 70% in 2018.

                      Developers fly with a G Suite flock

                      We also looked at correlations in our user base to see if there were any notable trends. One caught our eye: the link between developers and G Suite.

                      Companies with G Suite Are More Likely to Be Developer-Centric

                      We noticed that companies investing in developer tools are three times as likely to deploy G Suite as are “non-developers” (companies without any developer tools). Our data shows that 46% of companies with at least one developer tool also have G Suite, vs. only 17% of non-developers. How does that break out on a tool-by-tool basis? Okta customers with G Suite are 3.7 times more likely to have Pingdom, 3.5 times more likely to have Datadog, and 3.3 times more likely to have GitHub than are companies who do not deploy G Suite.

                      The More Factors the Merrier... and More Secure

                      Broad MFA, because Kanye’s not the only one with “000000” as a password

                      It’s no secret that if you’re online, you’re at risk. 2018 has been a groundbreaking year when it comes to cyberattacks, with 1138 breaches as of early December, exposing over 561 million records. And these breaches are expensive. According to the Ponemon Institute’s 2018 Cost of a Data Breach Study, the average cost of a stolen record is $148, and the total cost incurred from a data breach averages $3.86 million. Organizations took an average of 197 days to identify a breach, and 69 days to contain the breach. The pain doesn’t stop there: once breached, there is a 32% likelihood of a recurring material data breach over the next two years.

                      Survey says...

                      Passwords alone are insufficient for data protection, especially when you factor in human error. Nearly 40% of survey respondents told us they recycle the same 2-4 passwords for almost everything, and 10% reported using just one password. In a positive twist, 1 in 5 respondents claim to use a unique password for every single account. Bravo!

                      But the hardest part about using a unique password for each account is actually remembering that tricky combination of numbers, capital letters, and symbols. In fact, 26% of survey respondents admit to regularly writing down their passwords on a sticky note or piece of paper, and 7% have even shared their usernames and passwords with other colleagues. Plus, 43% say they only change their passwords when required to do so.

                      View LegendView Full Screen

                      Survey Insights: How Employees Save Passwords

                        This bad behavior reveals a big opportunity for companies to automate the password process. A quarter of survey respondents want their companies to automate passwords and logins, which is second only to the desire for companies to automate software updates (29%).

                        Across the Okta Integration Network, we see more companies turning to MFA to reduce the risks that come with bad passwords and protect against costly breaches. And they’re looking for flexibility in the factors they use, as well as the options they provide their employees. Some companies choose to tailor their factors to particular groups, adding stronger authorization for executives or customers than for average employees. We analyzed how many factors organizations use and which ones, and explored how their needs are changing over time.

                        View LegendView Full Screen

                        Of Okta Customers with MFA, Distribution by Number of Factors Deployed

                        Number of Factors

                          Most companies — 70%, in fact — are using two to four different factors. This number is up from 65% last year. And 29% of companies are using four or more factors.

                          Note: Each data point includes customers with MFA authentications within the last 30 days.

                          So, which factors are on the rise, and which are on the decline? The latest Digital Authentication Guidelines from the National Institute of Standards and Technology (NIST) shift away from recommending SMS text messages as one of the factors in two-factor authentication. Security researchers have less faith in SMS, as hackers find more and more ways to remotely intercept or redirect SMS texts. When it comes to security questions, many answers are available via public records, such as your mother’s maiden name, and it’s likely the name of your first dog is mentioned somewhere on Facebook or Instagram. Google’s research confirms that secret questions generally offer a security level that is far lower than user-chosen passwords.

                          When we look at the percentage of Okta customers using various factors, we see a slow but steady shift toward more secure factors (app generated codes, push authentication, and physical keys) and away from lower assurance factors like SMS and security questions.

                          The two most commonly used factors are Okta Verify (a mobile app-based factor) and SMS. Use of Okta Verify has increased by 13 percentage points in the past three years, whereas SMS has dropped 3 percentage points. Security questions have shown the largest drop, from 29% three years ago down to 18% today.

                          View LegendView Full Screen

                          Percentage of Customers with Less Secure Factors Adding More Secure Factors

                          Percentage of MFA Customers
                            Within years since first factor enrollment

                            A small percentage of organizations at first adopt less secure factors, such as SMS or security questions. But most eventually up their game by adding more secure factors, such as a mobile app like Okta Verify, Google Authenticator or Duo, or token-based YubiKey. Of the customers who initially only enrolled less secure factors with Okta, 41% added more secure factors within a year, 67% added more secure factors within two years, and 76% added more secure factors within three years.

                            Which of the more secure factors are added most frequently? Two years out, 71% of customers had added Okta Verify, and 44% had added Google Authenticator, while 15% had added YubiKey and 5% had added Duo.

                            More Companies are Mastering HR

                            Investing in people means investing in HR tools

                            How is technology changing the field of HR? Based on the growing influence of millennials and increasing transparency from the digital age, experts predicted that 2018 would be the year leaders truly invested in the 'employee experience.’

                            Our data shows that companies are leveraging their HR systems in new ways, and investing in up-and-coming tools. Three of the top 10 apps by number of users are HR-related, with HR systems Workday and SAP SuccessFactors at #2 and #8 respectively.

                            We see apps in the HR field growing steadily as well. Namely claims the fastest growth by number of customers, with 67% year over year, closely followed by BambooHR at 51% and UltiPro at 50%. Chart-topping Workday has the fifth fastest growth with 28% year over year.

                            View LegendView Full Screen

                            Percentage of Customers Leveraging HR-Driven IT Functionality Among Customers Deploying HR Apps

                            Percentage of Customers with HR Apps with Mastering Enabled

                              One of the big trends we’re seeing is that HR teams are now increasingly responsible for onboarding and offboarding users, a role traditionally owned by IT. They are using HR systems like Workday, Namely, and BambooHR as the source of truth for employee records, instead of older, on-prem directories. This eliminates manual, inefficient processes, which are typically error-prone and require ongoing back-and-forth between HR and IT. New employees are only given access to relevant apps, and HR can instantly deactivate all access to corporate accounts (including native mobile apps) for exiting employees.

                              Welcome to the Planet of the Apps

                              We’ve looked closely at how end users get their work done, and we asked ourselves: beyond the popular collaboration tools, what apps do employees use to work effectively with their colleagues? How do workers plan their travel? What project management tools do they use? And what apps do they choose to manage their daily lives, from reading the news to tracking their finances to managing healthcare?

                              Are you taking a work-cation, or traveling for bleisure?

                              Millennials now make up 35% of the American workforce, the largest single category. This generation doesn’t mind packing their bags and hopping on a plane for a business trip — they embrace it. A recent Hilton Hotels survey found that 75% of young professionals see business travel as a major perk, more than half create reasons to travel, and 39% wouldn’t take a job that didn’t allow them to travel! (Hey, nothing keeps an Instagram feed fresh like selfies from around the world, right?) But this is not your mother’s business travel. Many millennials will loop in a vacation while they’re on a business trip, creating a new blurred-line category of “bleisure” (business + leisure) travel. Airbnb reports that more than 30% of “Airbnb for Work” bookings in the past year included at least one weekend night.

                              Of course all this travel is costly. Global business travel is estimated at $1.4 trillion annually. So how can companies help their workers be productive, cater to workers with a travel bug, and still meet their bottom line? We’re seeing some interesting trends in business travel that make it possible.

                              Note: In January 2016, Okta enabled customers to securely store private credentials when they visit any new site, thus the significant increase of all personal app usage around that time.

                              Hotels and Lodging

                              Note: Data includes both personal and corporate apps.

                              In the past year, we’ve seen Airbnb climb from #4 to #2 in the most popular hotel and lodging apps. This jump represents more than just personal travel. Airbnb has invested in its business platform quite a bit since it launched in 2014, announcing a partnership with Concur and encouraging shared lodging to help workers avoid costly hotel bills in expensive cities. The company recently reported that 60% of “Airbnb for Work” reservations have included more than one guest. For the more traditional hotel experience, the Starwood Hotels group (which includes the Westin, Sheraton, and W Hotels) and Marriott lead the pack. This spring, Marriott International (which acquired Starwood in 2016) announced a new loyalty program with unified benefits across Marriott Rewards, The Ritz-Carlton Rewards, and Starwood Preferred Guest beginning in August. The individual rewards programs will be consolidated in 2019.

                              Air Travel

                              Note: Data includes both personal and corporate apps.

                              Southwest Airlines, a popular choice for families, has locked its radar on business travelers as well: Southwest flew into the #1 spot over two years ago and continues to gain altitude. United, American, Delta, and JetBlue have all enjoyed strong growth over the past two years, but we were impressed by American Airlines’ jump this past spring.

                              Ground Transporation

                              Note: Data includes both personal and corporate apps.

                              Business travelers need to hit the ground running. For the past year, Uber has held the top spot in the ground transportation app race and continues to grow. Its Uber for Business dashboard, launched in 2014, allows customers to consolidate payments, generate rolled-up reports, and set customized rules for things like vehicle class and spend allowances. Uber was recently the most expensed vendor for U.S. business travelers based on the number of transactions, accounting for 11% of all transactions. (Second-place Starbucks only claimed 4% of the total.)

                              News flash: big shifts in personal finance and banking, and news

                              Note: Data includes both personal and corporate apps.

                              Roughly nine in ten adults (93%) get at least some news online, via desktop or mobile. The New York Times has seen digital become the fastest-growing part of their business, with revenue topping $450 million in the first nine months of the year. We see strong demand for news apps among our user base, with growth across the board — most notably for The Wall Street Journal, which surpassed CNN as the most popular app for Okta customers. What changed? Well, last year, parent company Dow Jones & Co. set a goal of reaching 3 million WSJ subscribers across its titles on print and digital and ramped up product testing with a focus on increasing consumption, time spent on the site, subscriber retention, and event attendance. Dow Jones reached its goal in April 2018, and the WSJ’s growth is reflected in our dataset as well.

                              Note: Data includes both personal and corporate apps.

                              PayPal is a perfect example of how the power of network effects can grow the user base of modern banking apps. PayPal adoption seemed to be leveling off in 2017, but a jump in 2018 kept the online payment company at the top of the stack. The general prediction for 2019, be it from Information Age, G2Crowd, or others, is that financial technology (“fintech”) will continue to disrupt the traditional banking sector with new innovations and automation to improve the customer experience.

                              Healthcare is making more house calls

                              Note: Data includes both personal and corporate apps.

                              Teladoc enables its members to speak to a licensed doctor via video chat or phone within minutes, 24 hours a day, 365 days a year. Sound convenient? Users think so. Teladoc rose from the bottom of the list, shooting up 280% in the past two years to blow past apps from household-name providers such as Aetna, Cigna, and UnitedHealthcare. It’s the first time telemedicine has taken the top spot.

                              Where there’s an app, there’s a way

                              Whatever projects you’re taking on, there are plenty of project management apps available to help. You could spend an entire week searching through the range of apps designed to help you work more efficiently, but we’ve seen a few outpace their peers in efficient rises to the top.

                              Note: Data includes both personal and corporate apps.

                              Taking sticky notes and whiteboards digital, Trello has hit a sweet spot in the project management space. Purchased by Atlassian in 2017 for $425 million, Trello has grown 119% over the past two years and is the most widely used project management app overall. The second most used project management app is Asana, whose growth over the past two years has only been 18%. In third place, Basecamp is heating up with a strong 43% growth over the past two years.

                              People @ Work

                              More meetings, more problems

                              Today’s employees run into hurdles that keep them from working at peak productivity — and they cite meetings as the number one offender. In fact, 73% who responded to our survey say they would rather read an email than have a meeting. When we asked about top productivity killers, outdated technology trailed behind meetings, and keeping up with emails and messages came in third. We think it’s safe to say that meetings are here to stay, but hopefully outdated technology isn’t.

                              View LegendView Full Screen

                              Survey Insights: Top Productivity Killers

                                Meetings and slow tech tools aren’t the only things that get knowledge workers down — video conferencing is also a source of frustration. Respondents in our survey ranked Skype as their least favorite (23%) and most stressful (16%) app to use, and revealed that video conferencing even makes them feel uncomfortable. Only 14% prefer video calls over audio-only. But they see it as a necessary evil: 63% have still participated in a video conference.

                                Survey Insights: Top Frustrations with Video Conferencing

                                The changing way we work

                                The modern office has undergone a massive transformation over the last few decades. We’ve taken our work to our phones and tablets, turned extra bedrooms into alternate offices, and torn down offices and cubicles in place of open-floor plans. But how do modern workers feel about it all? They like the idea of remote work — nearly 1 in 4 report already working from home at least half of the time, and 48% reveal they would rather work remotely every day. Open floor plans, however, are another story.

                                Survey Insights: Would You Rather?

                                For the 25% of survey respondents who work from home at least half the time, it’s all about comfort.

                                View LegendView Full Screen

                                Survey Insights: Typical Work-from-Home Attire

                                  Percentage

                                  The truth comes out: quirks of office and remote workers

                                  In a typical work week, there’s a lot that happens in the office that isn’t directly tied to the daily grind. To better understand the average employee’s habits, we asked: what are the secret quirks people might not be willing to divulge to an employer? We learned that some are running on office snacks, whereas others skip lunch for a workout. They’re also checking their dating apps during the workday, and aren’t afraid to fake a sick day every once in a while.

                                  View LegendView Full Screen

                                  Survey Insights: Office Worker Quirks

                                    Percentage

                                    All of this talk about dating apps and online shopping may have you wondering: where is the line between business and pleasure? It is blurring, but knowledge workers aren’t worried. According to our survey findings, 58% say their employer can read their work emails and messages, but 57% aren’t concerned about it one bit. More than half (53%) feel confident that their employer respects their digital privacy. But the trust ends there: 44% are concerned that email providers are collecting their personal data.

                                    The Wr-app Up

                                    In order to keep their workforce productive and working in harmony, organizations are adopting tools and solutions at a rapid rate. Identity-driven security and HR-driven IT provisioning keep organizations light on their toes, with their data safely buckled away. Network effects are forcing dance-offs between 800 pound gorillas, while launching scrappy startups that offer differentiated functionality into the spotlight. Larger companies are doing the hybrid IT shuffle, adopting an increasing number of cloud apps, while modernizing connections to on-prem systems. It’s a crowded dance floor of apps and services, and the DJ never stops spinning the tunes. We hope this report helps you see above the crowd, offers you some fun insight into your worker’s preferences, and ultimately prepares you for your next move.

                                    2019 Businesses @ Work