An in-depth look into how organizations and people work today—exploring employees, partners, contractors and customers, and the apps and services they use to be productive.
Business computing is happening everywhere, at our desks, at home, on mobile devices, in watches and cars, and work is transforming rapidly because of it. Organizations—regardless of size, industry and location—are taking steps to enable employees, partners, contractors and even customers with the apps, devices and services they need to be productive, while also securing increasingly mobile workforces. Our data supports what Okta investor Marc Andreessen has preached for years—every company is a software company. In the past year, we’ve witnessed the hyper-growth in usage of cloud and mobile applications around the world, the increasing demand to protect critical business information and the rapid adoption of best-in-class security standards by developers and companies alike. This report uses Okta’s dataset of 2,500 customers, 4,000 apps, thousands of integrations and millions of daily logins to answer questions around how organizations and the people that work for and with them get work done today. We review which applications, devices and services businesses and their people (employees, contractors, partners and customers) consume, and how geography, business size and industry impact access to, security and popularity of the tools people use every day.
Key Findings
Size doesn’t (really) matter in the cloud:
Company size is no longer a strong predictor of how many cloud or mobile apps a company uses, or how they secure them—most businesses use between 11 and 16 off-the-shelf cloud apps, and we’ve seen a 40 percent increase year over year in Okta’s dataset of companies protecting their sensitive data with multi-factor authentication for at least one app. The new computing environment allows businesses of every shape and size to provide tools that employees, partners and contractors need. The smallest companies now have access to the same tools, services and apps that large enterprises do, and they can use more of them too if they want!
If software is eating the world, businesses are hungry. Nom, nom...
Businesses are making aggressive efforts to enable their partners, customers and contractors through new cloud-based applications, websites, or portals. Even we were surprised—the number of our customer’s external identities in the cloud grew 284 percent from July 2014 to July 2015, while our internal identities grew 192 percent in the same timeframe.
The reliance on security questions—“what’s your mother’s maiden name?”—is declining:
With new authentication options on the market, companies and employees are moving away from requiring confirmation about birthplaces and bloodlines and towards greener, more secure pastures. The classic “security question” is on the decline as a form of verification (dropping 14 percent since April 2014) with businesses now bringing on multi-factor authentication options like SMS (which increased 8 percent in the same time frame) and push notifications for phones and watches. If we were betting folks, and we are, we’d say biometric authentication will be the next big factor of authentication for businesses.
“You’re either in, or you’re out” —enterprise apps can be easily ousted:
Over the past several years, we’ve seen enterprise apps rise in popularity and maintain those positions, but then suddenly fall out of favor with businesses and their people. Certain enterprise apps maintain early leadership positions—Salesforce.com in CRM, AWS in infrastructure and Box in content management—but others have lost ground to competition, including Google Apps now trailing Microsoft Office 365 in almost every category. Media darling Slack has also come on strong, increasing usership 50 percent in May 2015–July 2015. It’s more important than ever to constantly provide value to users, or they’ll leave as soon as something better comes along. There are so many apps that business users are empowered to bring on themselves, the new world requires IT professionals that live and breathe apps.
Asia Pacific might be down under, but not when it comes to enterprise cloud and mobile:
Ask anyone in software and they’ll suggest that Asia Pacific is two to three years behind the rest of the world in terms of adoption, but our data suggests the region is further along in a few ways. We see businesses in Asia Pacific leading in mobile adoption with an average of 23.8 percent of end users regularly logging in from mobile devices, and Asia Pacific is tied with North America in the median number of off-the-shelf cloud apps companies offer employees with 15 (as compared to Latin America’s 13.5 and Europe, Middle East & Africa’s 12 apps). Watch out world, Asia Pacific is on the move.
SAML is finally the security standard it set out to be:
As we’re putting a premium on security, developers are creating apps with the highly secure authentication mechanism SAML (which stands for Security Assertion Markup Language) baked in from the start. Six times more apps are SAML enabled today than two years ago.
Methodology
How did Okta prepare this report?
We analyzed anonymized findings from our dataset of 4,000 applications in addition to thousands of custom integrations, 2,500 enterprise customers and millions of daily authentications and verifications from 185 countries around the world. Our customers and their employees, contractors, partners and customers use Okta to login to devices, apps and services, and leverage security features to protect their sensitive data. Our customers span every industry and vary in size, from small businesses to enterprises with thousands of employees. We provided specific methodologies for complex data points in Appendix.
What should I keep in mind while reading this report?
Because Okta is a cloud-first identity and mobility management company, Okta’s customers are likely to be more cloud- and mobile-friendly than your average bear. Please consider this data to be of a directional nature rather than gospel. Since Okta is a private company, in many cases we’ve provided percentage growth numbers and comparisons rather than exact values.
Apps @ Work
The cloud has given companies and people the opportunity to work flexibly. Okta's data showcases what kinds of apps organizations are providing for their employers. We’ve uncovered how many apps companies across the world deploy, the most popular and fastest-growing apps among businesses, and what’s going on with email.
Median Off-the-Shelf Cloud Apps by Company Size
Median Apps Per Company Size Bracket, Over Time in Months
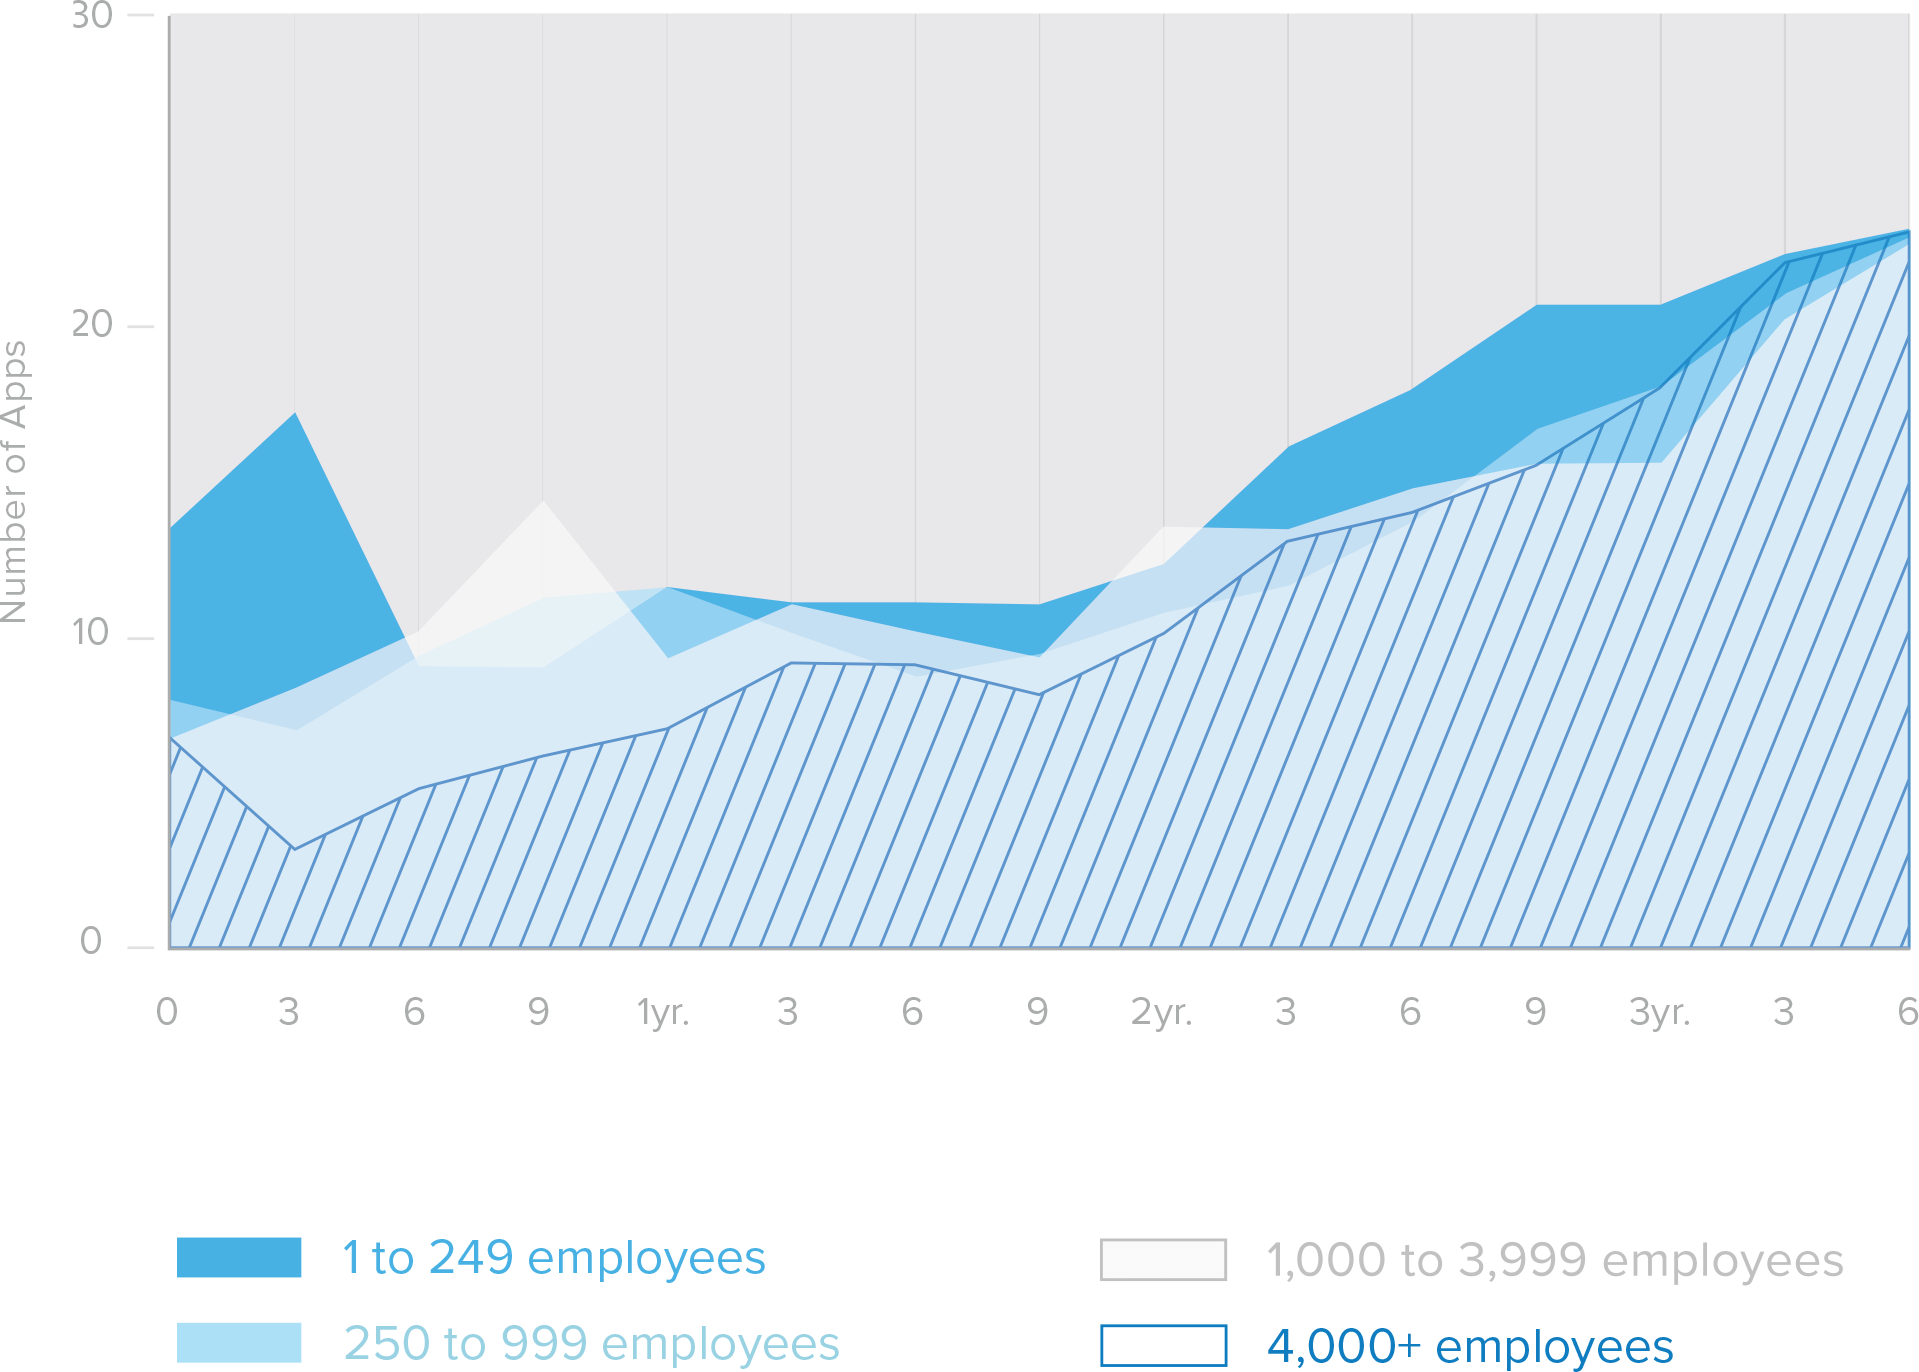
How many apps do companies use?
Surprisingly, Okta’s data shows that, today, company size doesn’t play much of a role in the number of off-the-shelf cloud apps employees can access. Employees at both small (1–249 employees) to mid-sized companies (with 250–999 employees) have access to the highest median apps, both at 16, whereas enterprises (4,000 + employees) come in fourth with a median of 11 apps. Companies with 1000–3,999 employees fall in between with a median of 14 apps. Although employees at smaller companies do use more apps, the difference between the highest and lowest is only 5. Companies of all sizes are adopting similar numbers of cloud-based applications for their employees to access at work. According to our data, the sweet spot lies somewhere between 11 and 16 apps.
Median Off-the-Shelf Cloud Apps by Region Over Time, Shown in Months
Data Collected from January 1, 2012 to July 1, 2015
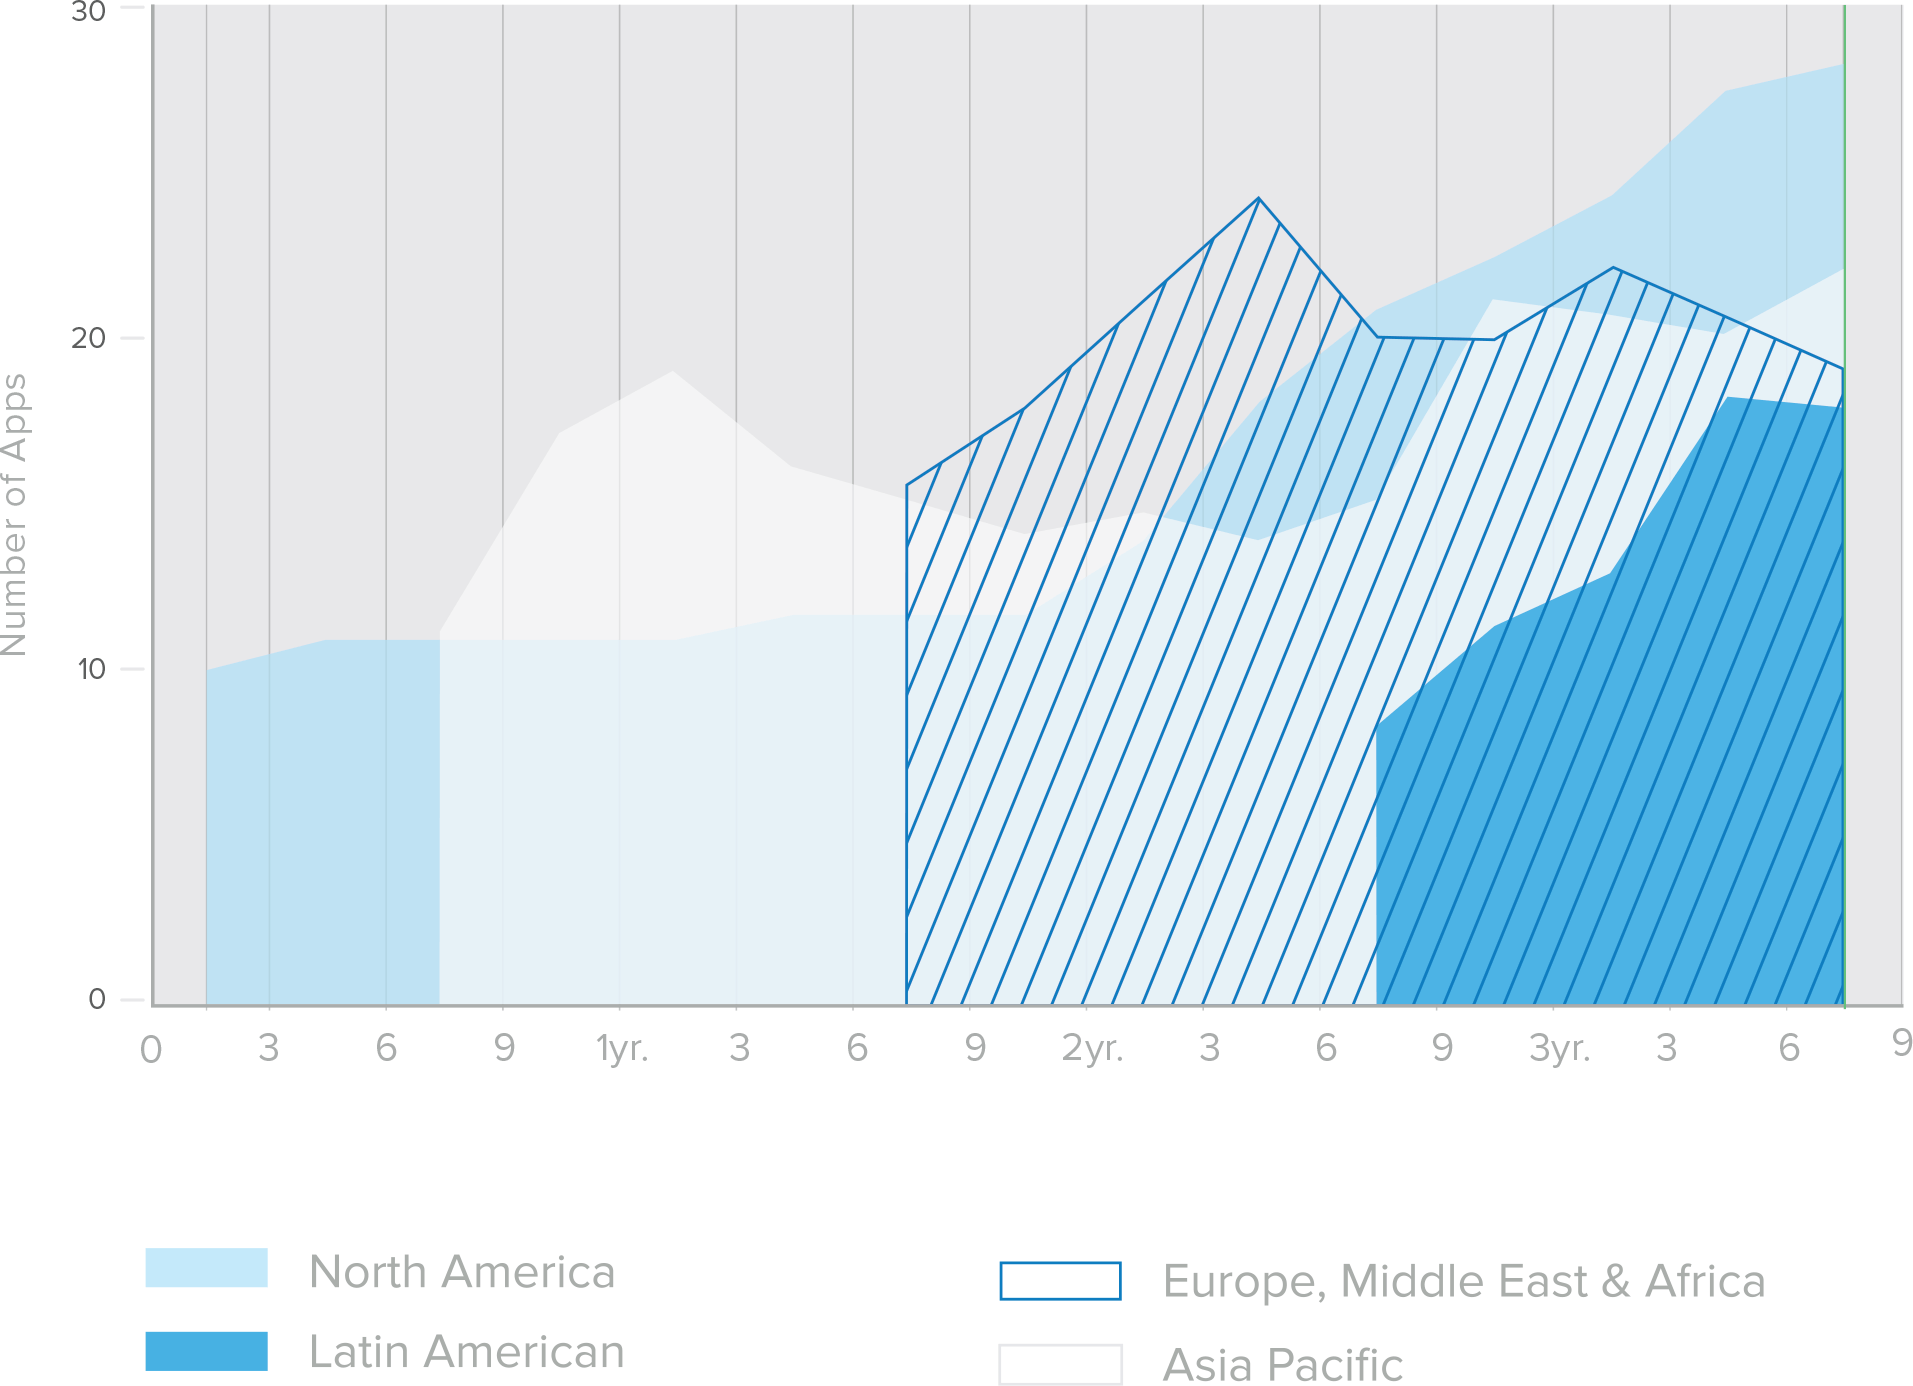
Does region affect the number of apps companies use?
Slightly, but not as much as you might think. North America and Asia Pacific lead the pack with 15 median off-the-shelf cloud apps per company. What’s more, our data shows that businesses in both Latin America and Europe, Middle East & Africa offer their employees a median of 13.5 and 12 apps, respectively, which points to steady (and comparable) cloud adoption in all regions.
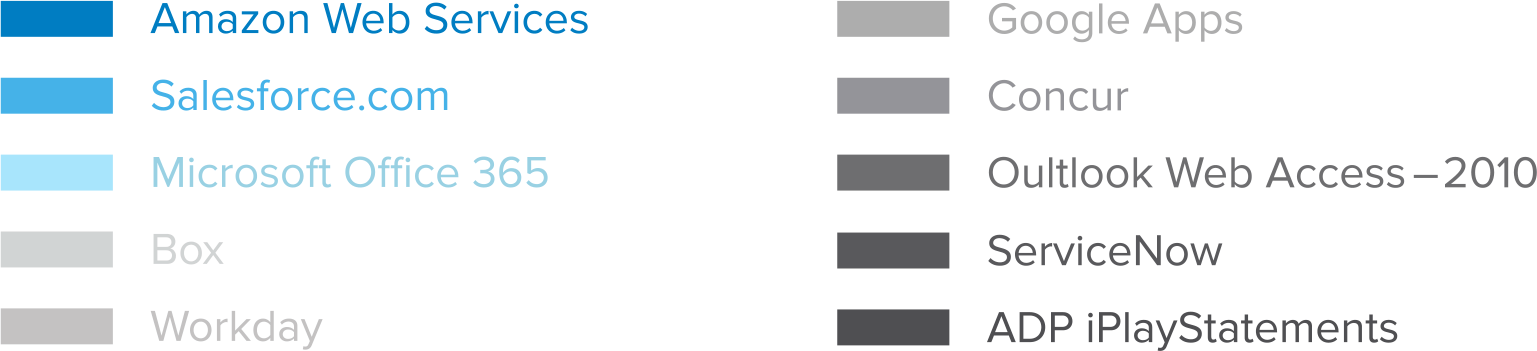
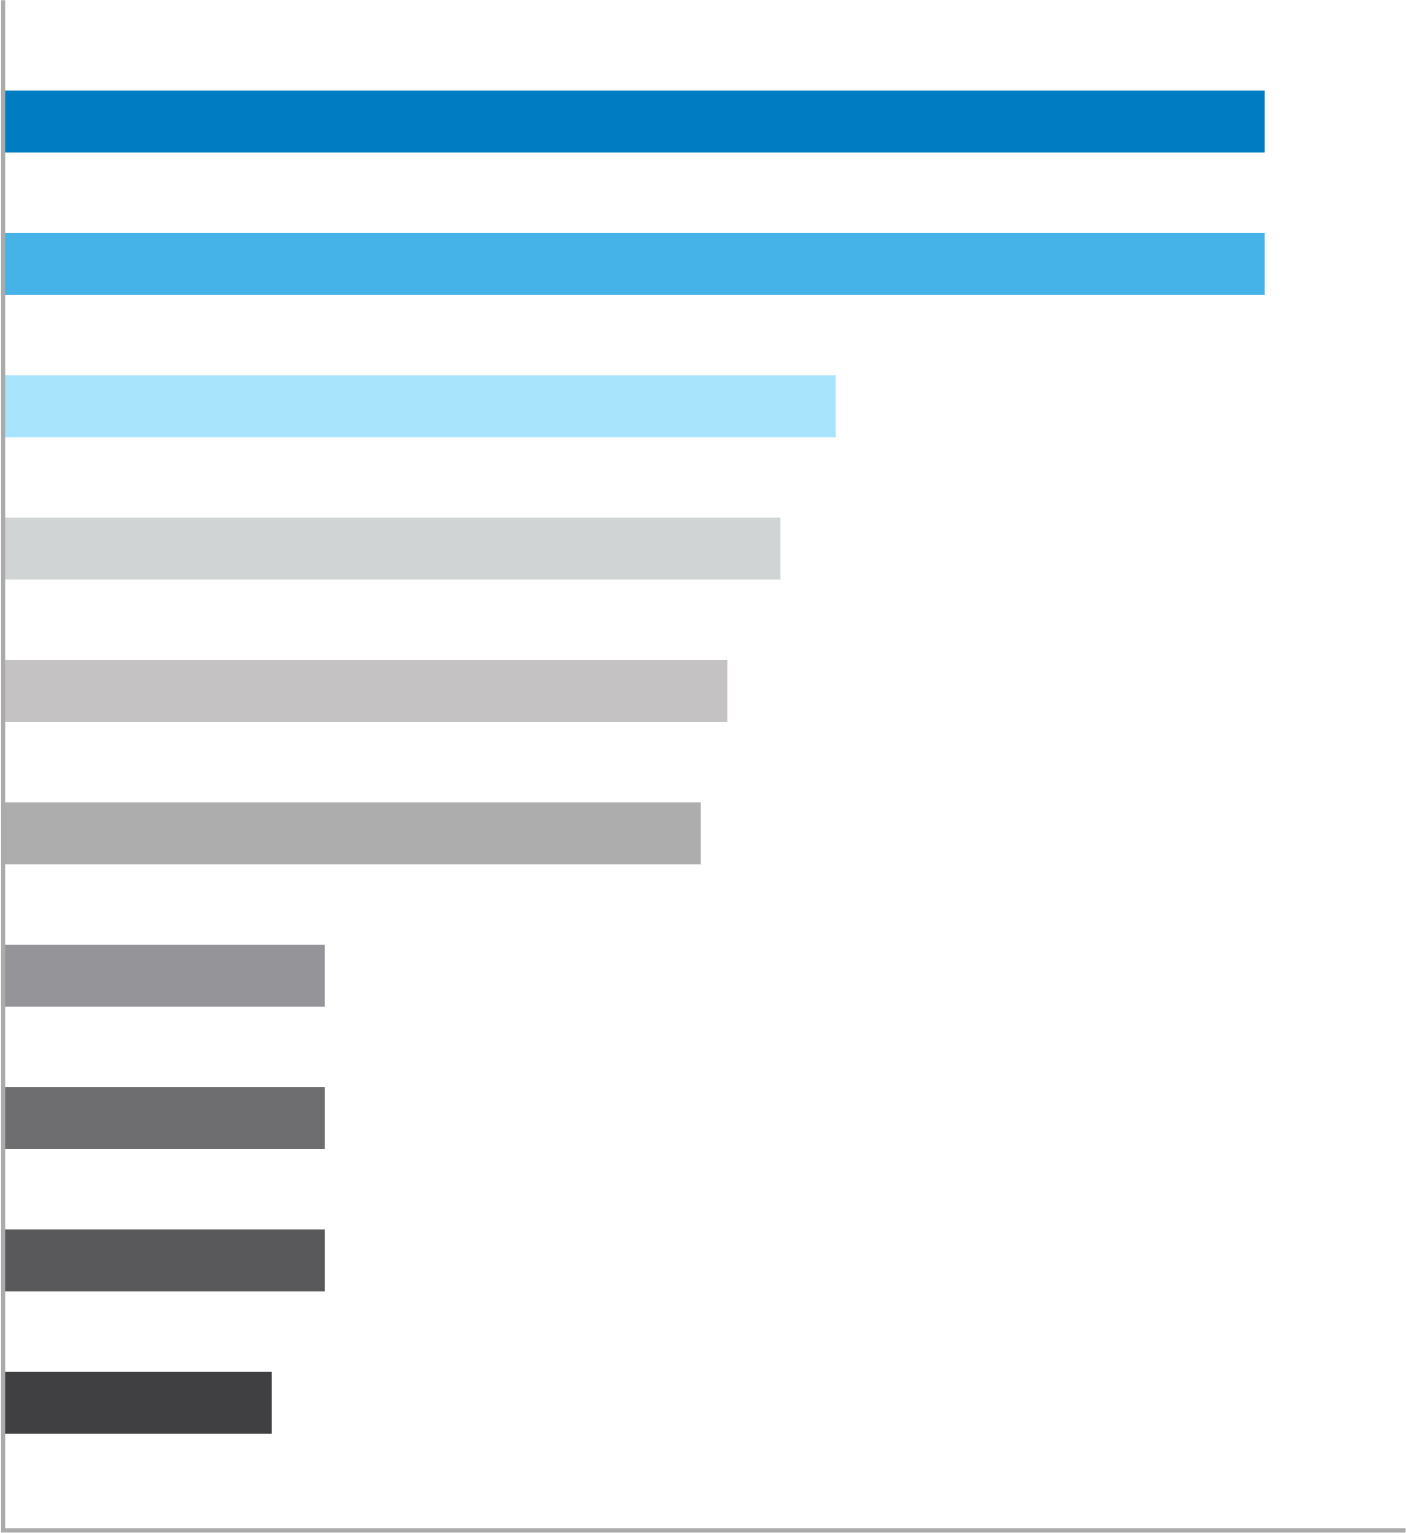
What are the most popular apps at work?
Okta is deeply integrated with over 4,000 cloud-based applications and our data clearly shows that Microsoft Office 365 has rapidly become the most deployed application worldwide. To measure app popularity, we tracked and organized the most commonly deployed and used applications by business within Okta. Since we started tracking app usage in early 2012, Salesforce has securely held the top spot as the most deployed application. However, in January 2015, Microsoft Office 365 dethroned Salesforce after a gradual climb to the top, evidence that Office 365 is successfully bringing large enterprises to the cloud.
Top Ranked Apps
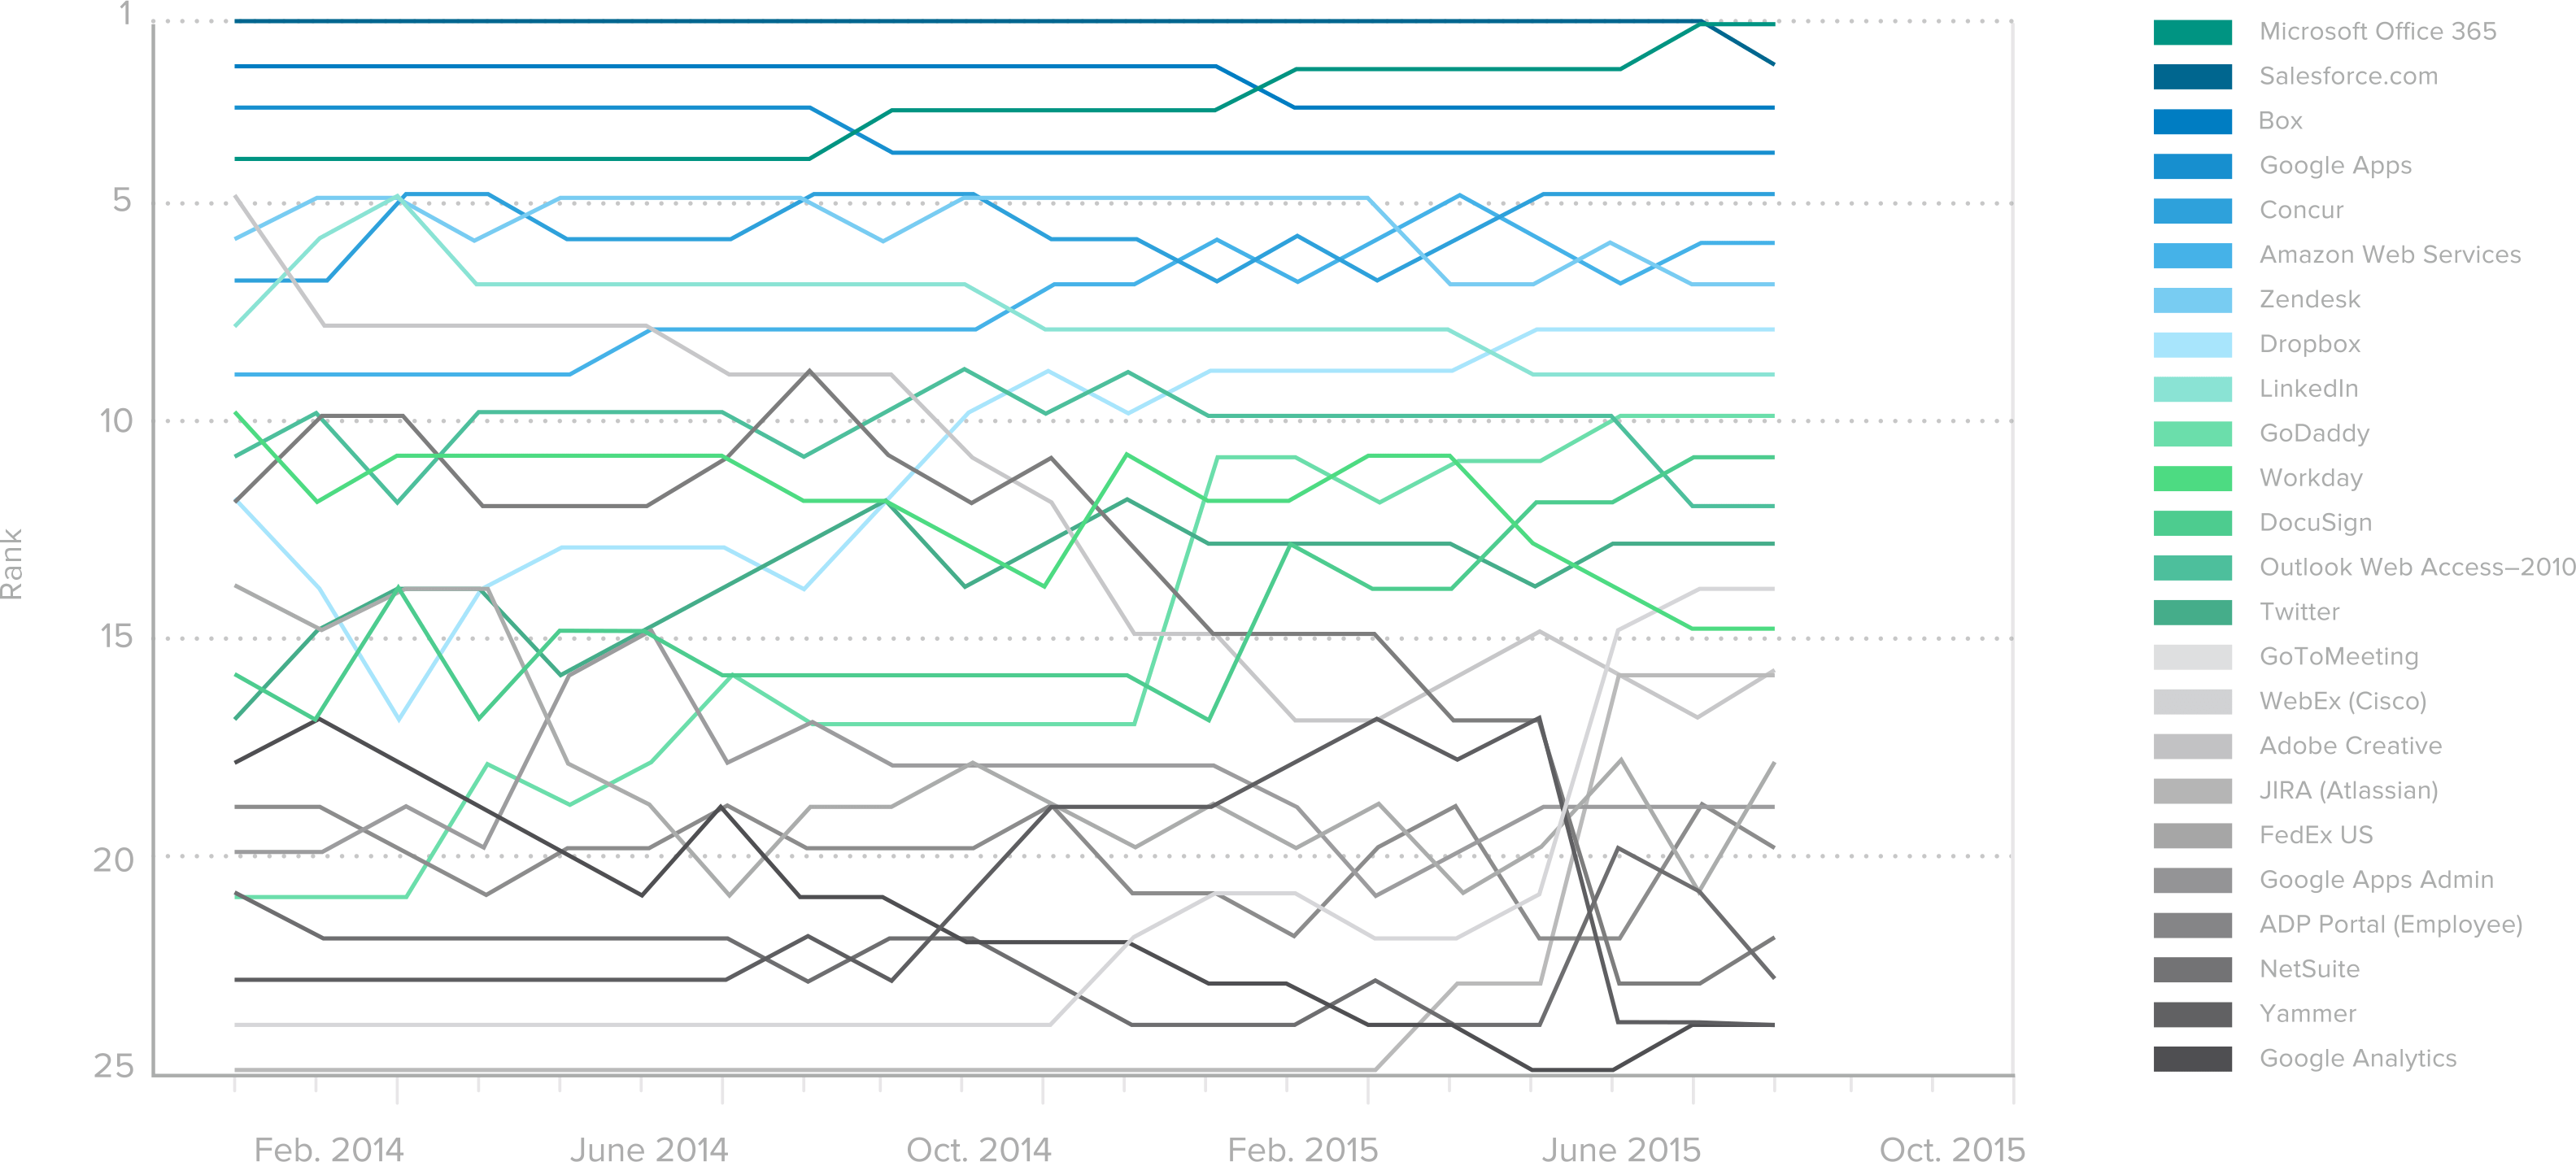
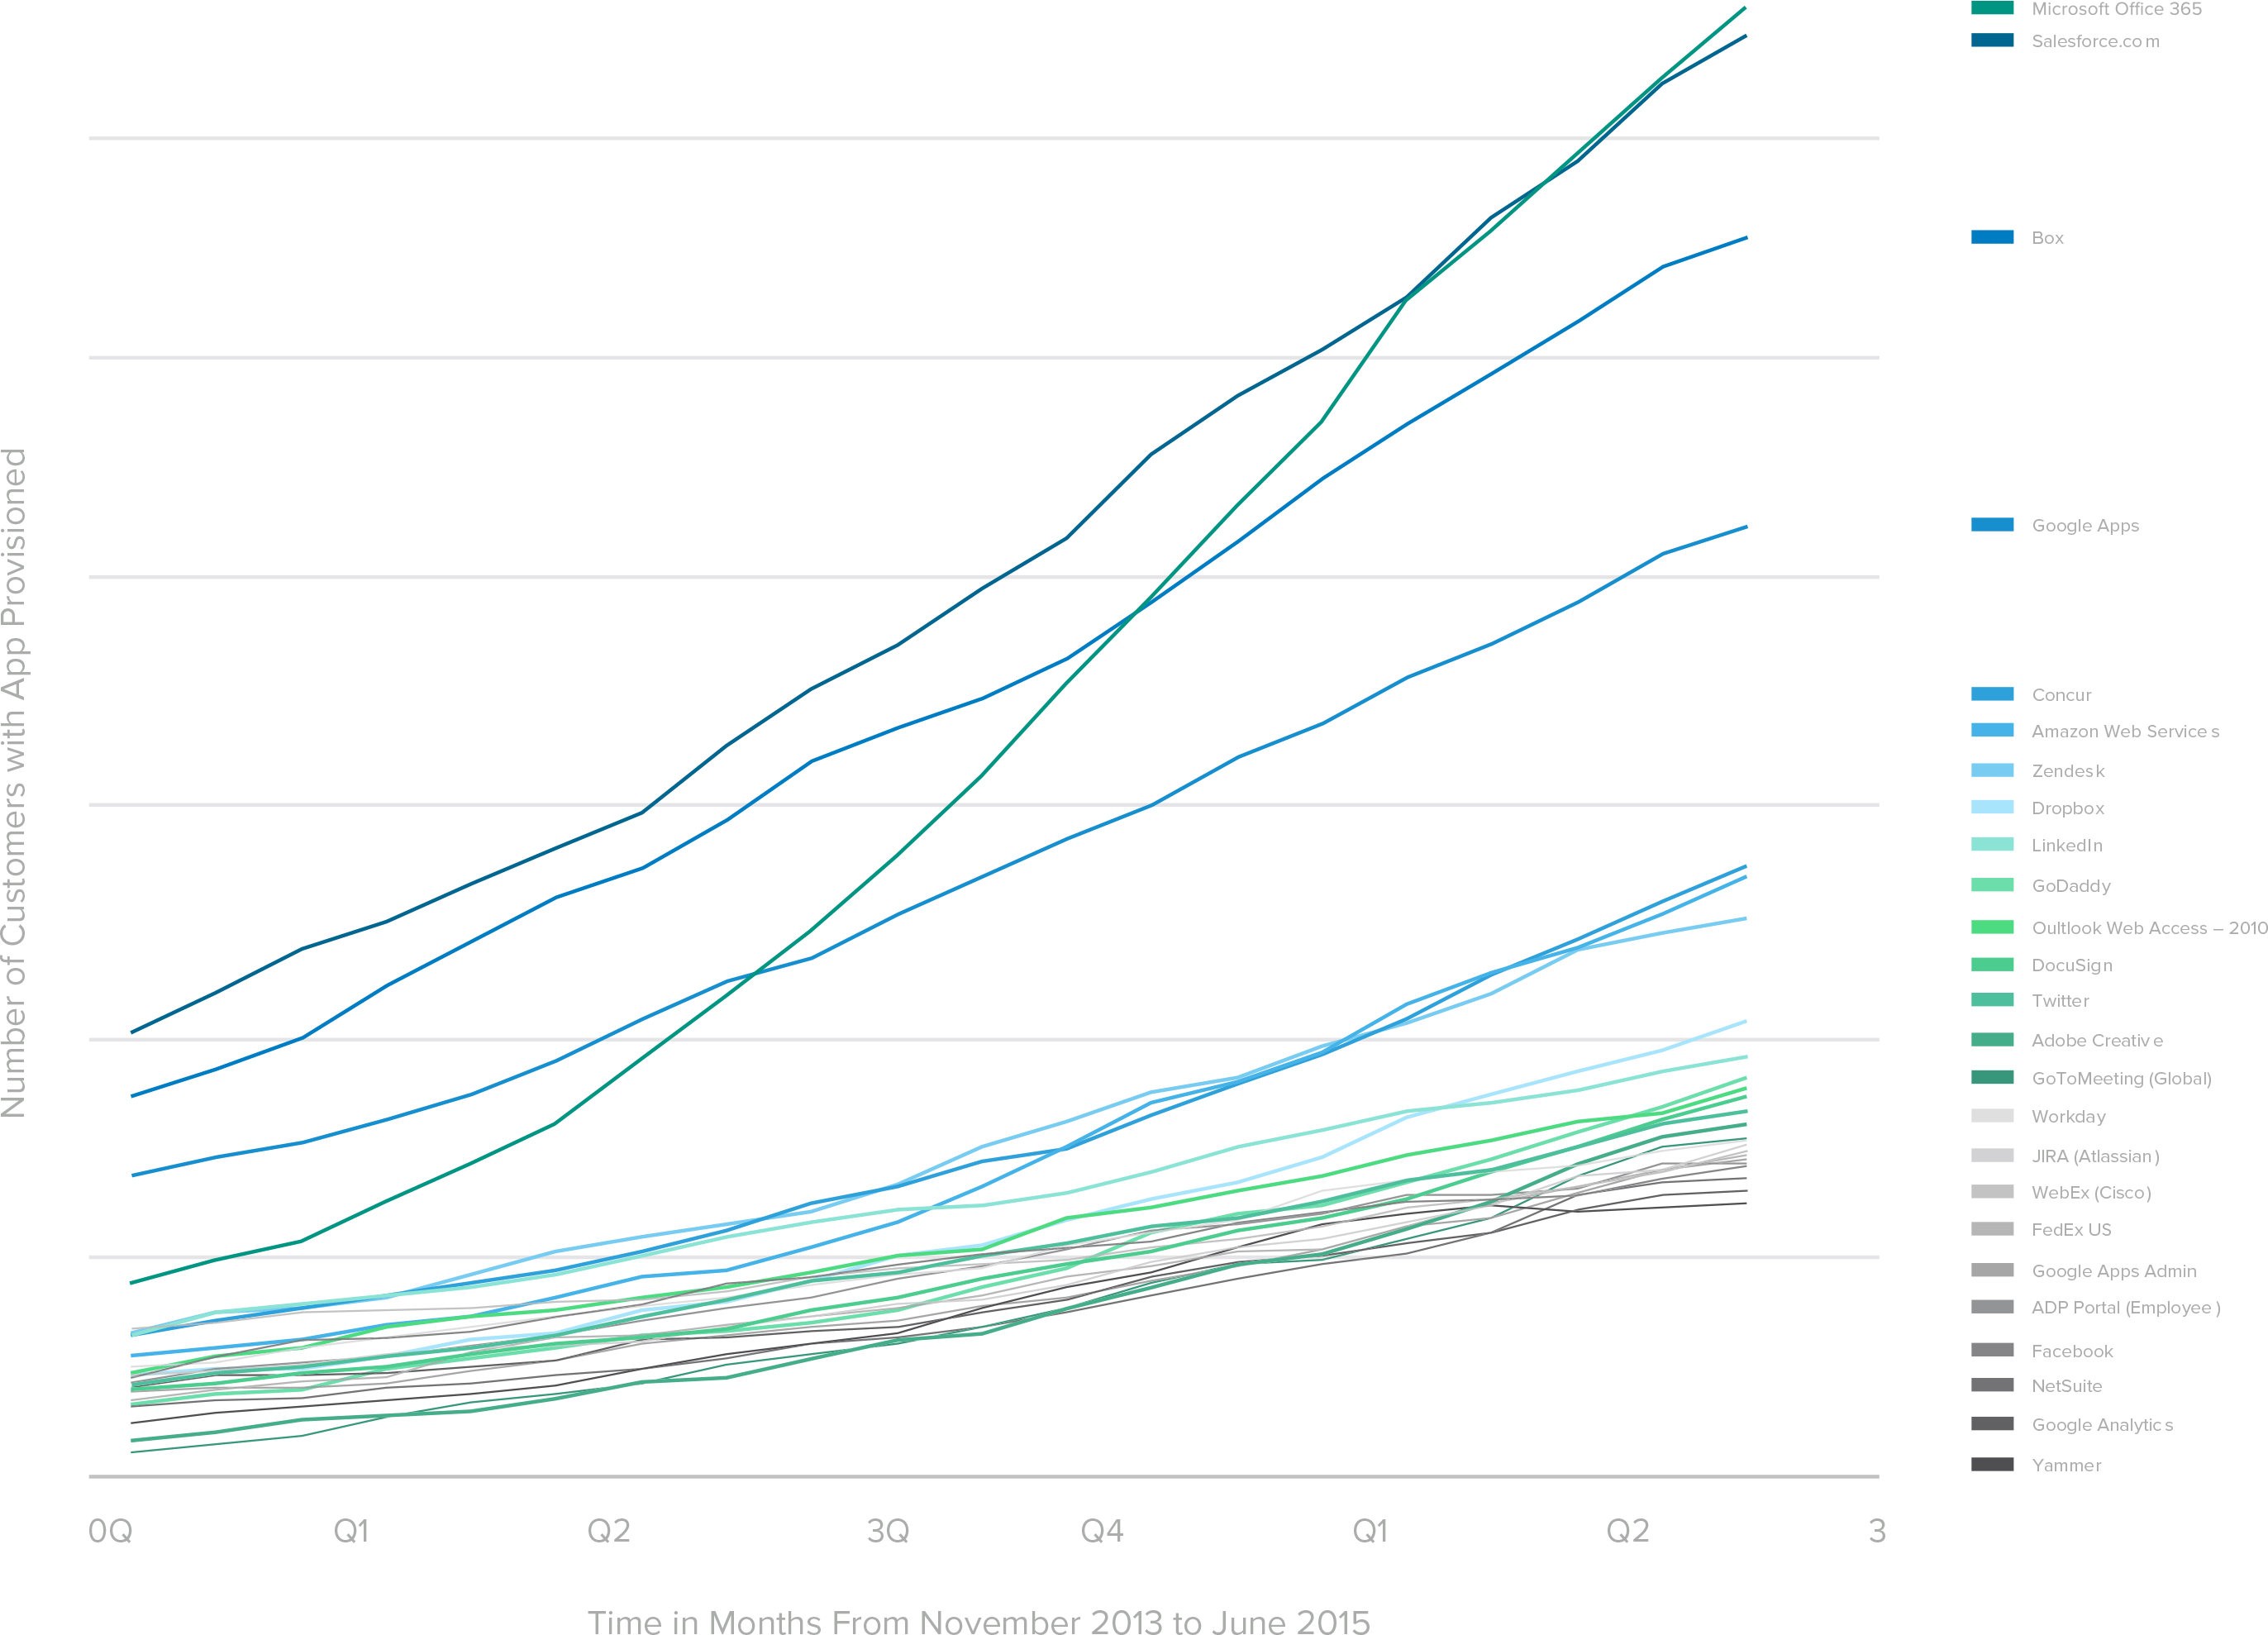
Most Popular Apps Trends Over Time
Fastest Growing Apps in Q2
Customers with App Provisioned From April 2015–June 2015
What are the recent fastest growing apps at work?
We’ve heard a lot in the media about Slack’s hyper-growth among enterprises and Okta’s dataset supports the hype. Slack was, far and away, the quickest growing app within Okta’s network from May to August in 2015. Interestingly, Slack is more popular with Okta’s customers within small and mid-sized companies. Workday is significantly more popular with businesses that have more than 1,000 employees.
Fastest Growing Apps in Europe, Middle East & Africa
Slack’s hyper-growth hasn’t quite translated to Europe, Middle East & Africa yet, though our dataset shows Slack has seen high traction in Asia Pacific.
Fastest Growing Apps in Asia Pacific
Adobe Creative Cloud is moving fastest in Europe, Middle East & Africa while Dropbox appears to be making headway with Asia Pacific and Europe, Middle East & Africa.
Top Apps by Category
What are the most popular apps for businesses in sales and marketing, software development, HR and content?
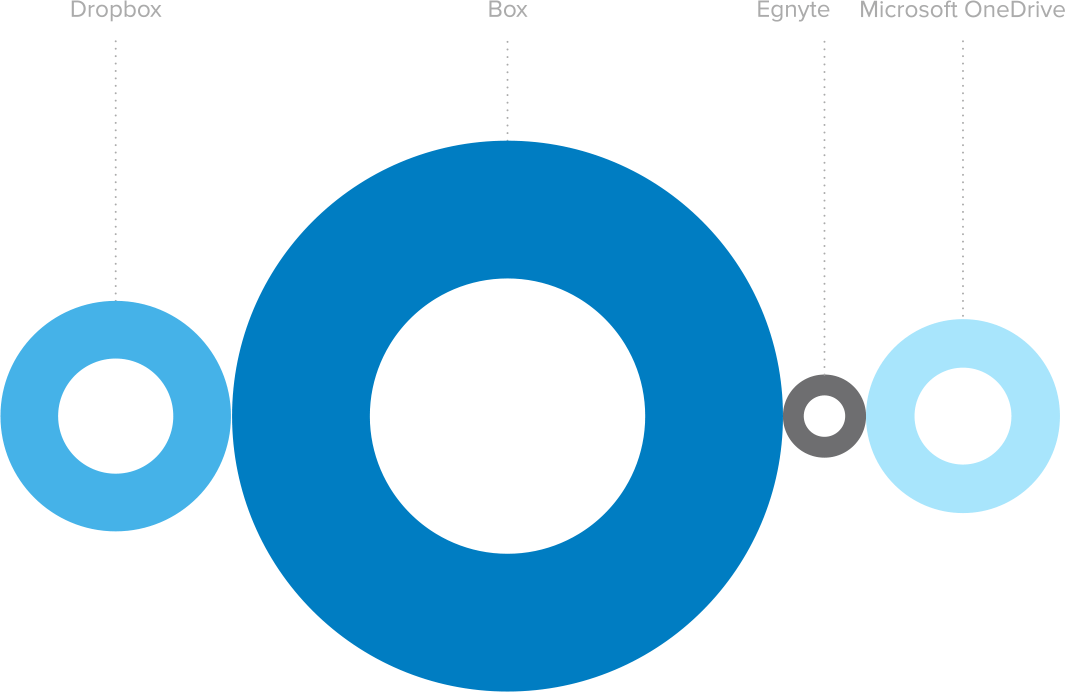
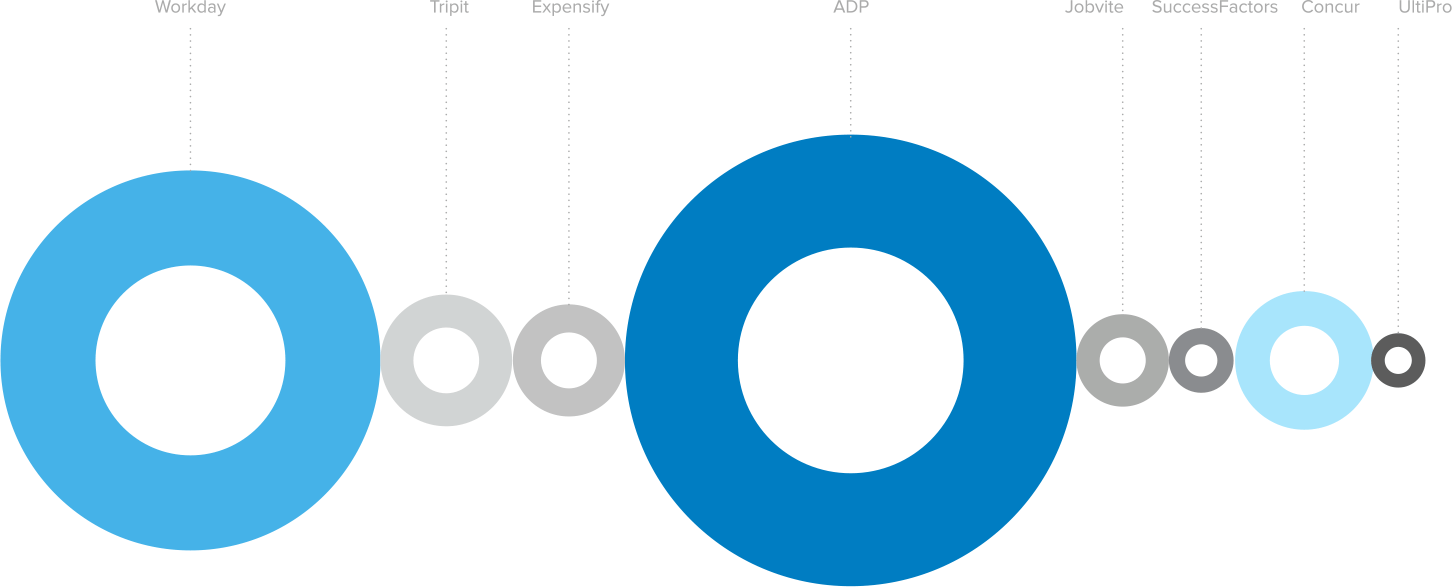
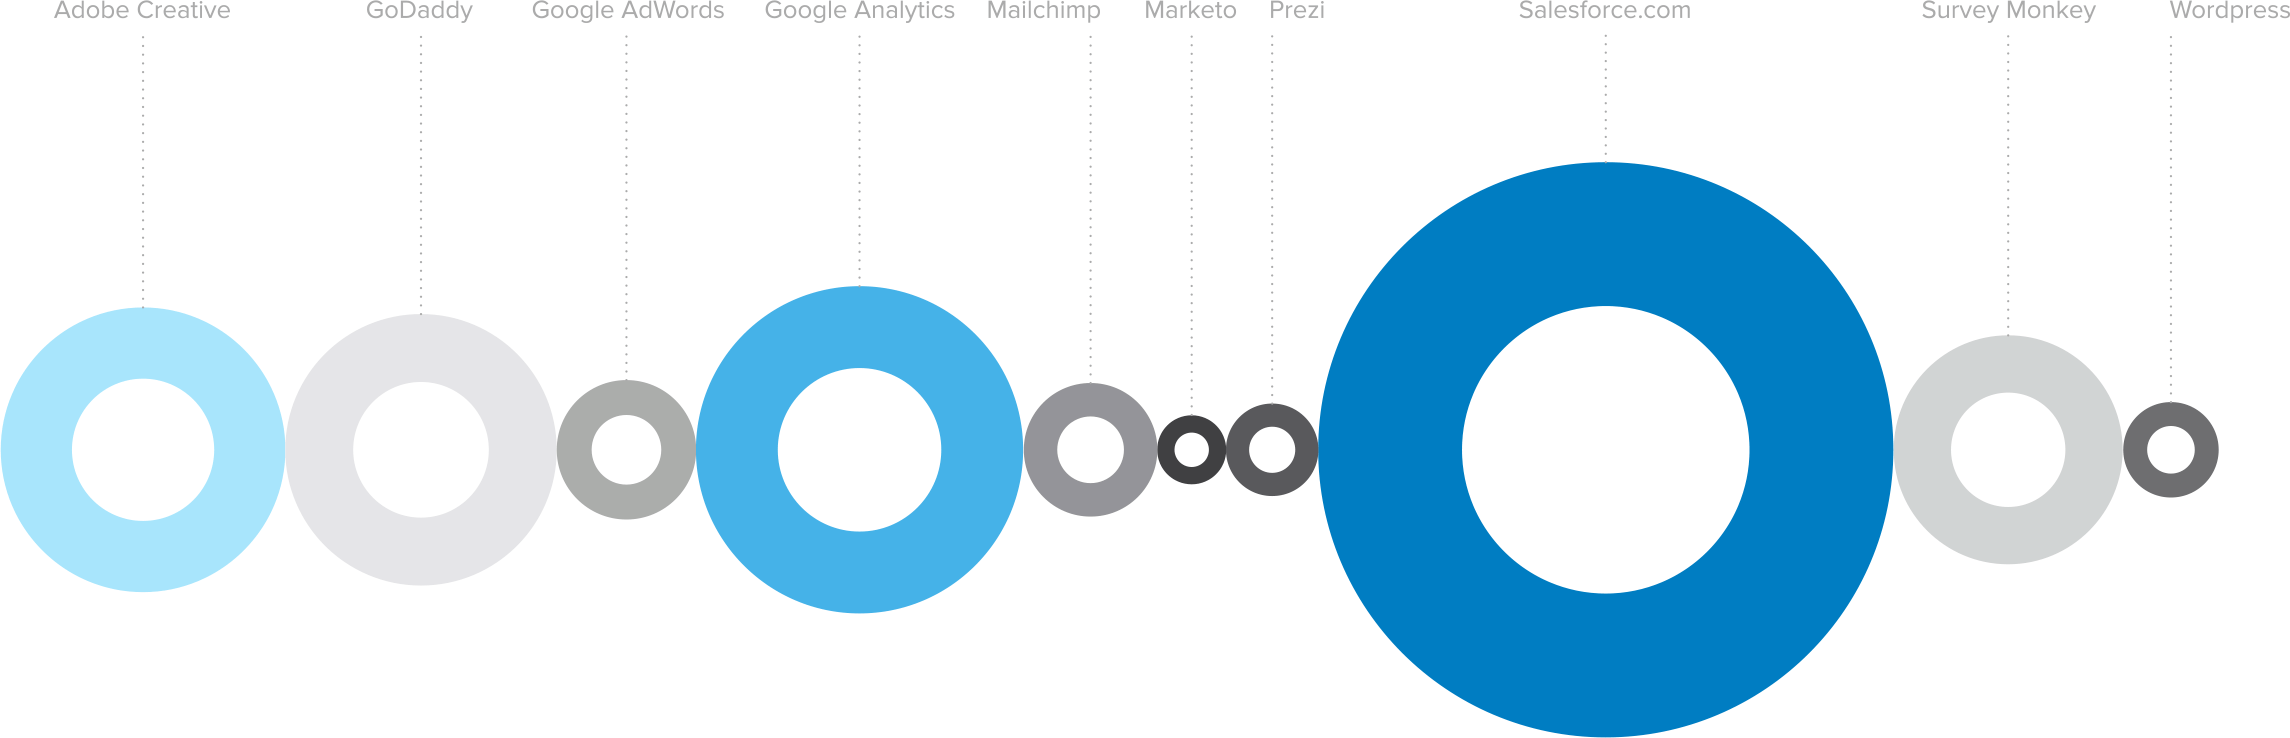
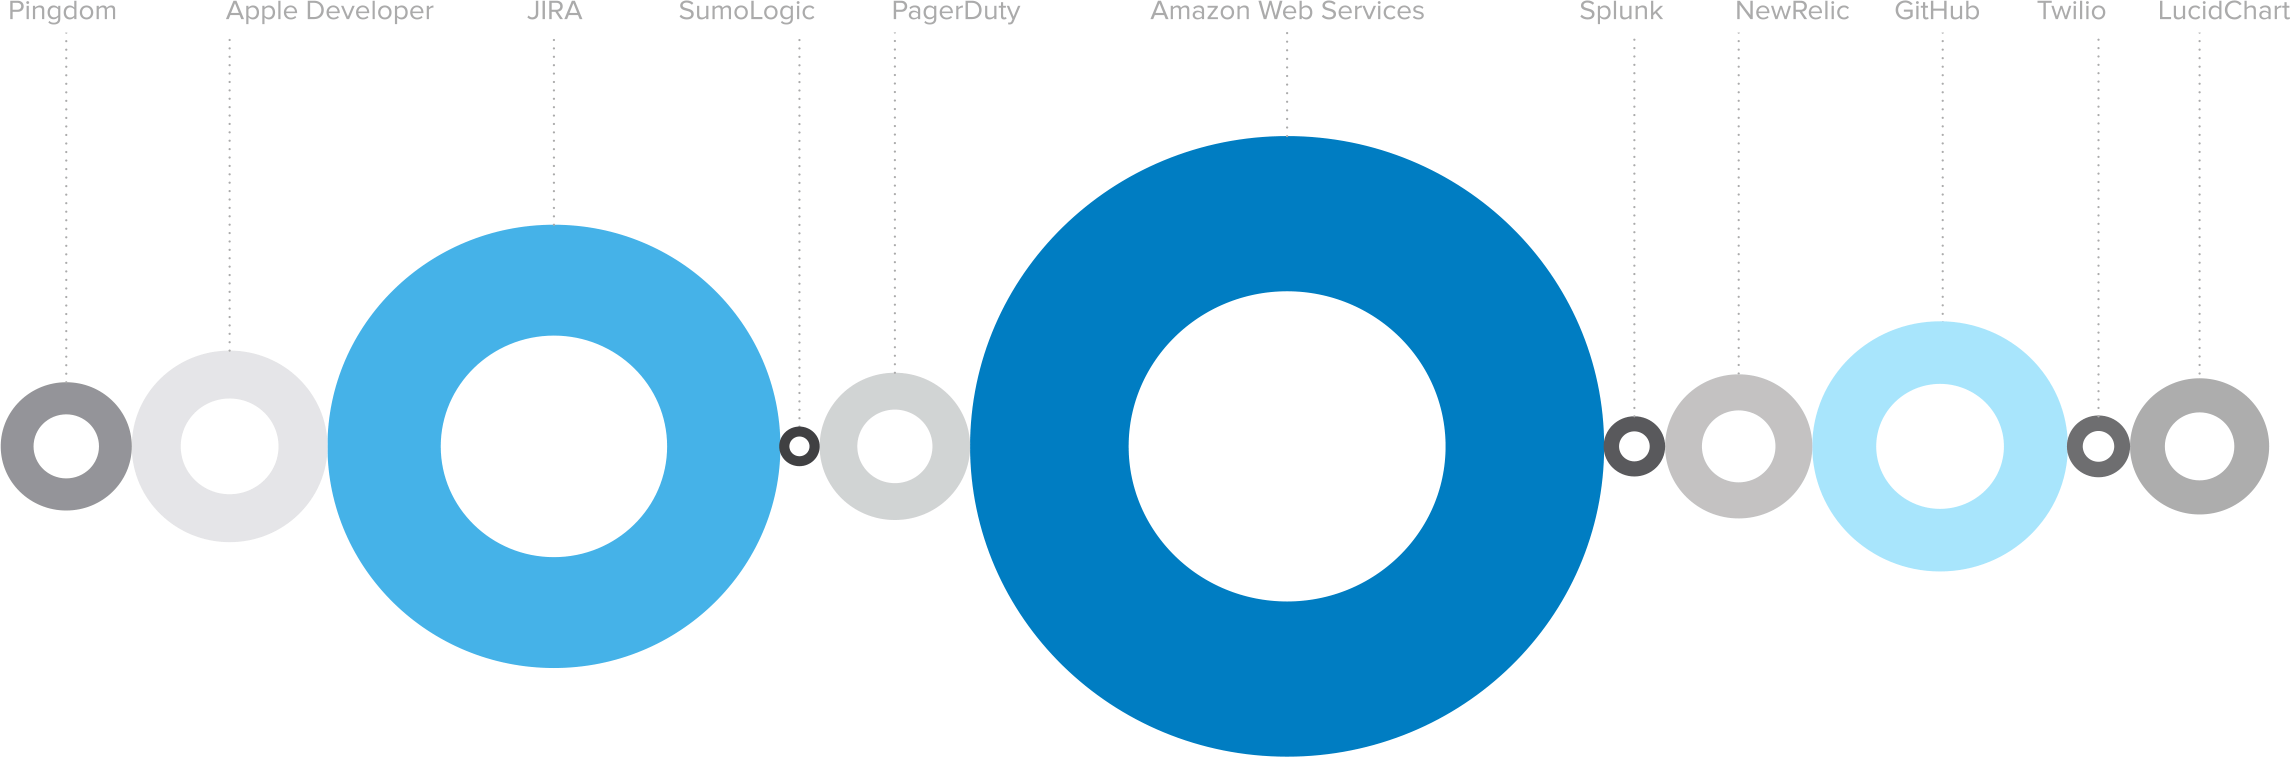
Everyone loves a good rivalry. Tech media likes to play up competition, which is why we’re so accustomed to seeing headlines like “Microsoft Targets Box, Dropbox” or “How Office 365 is Beating Google.” Lucky for those drawn to the cat fight, there’s plenty of competition when it comes to sales and marketing, software development, HR and content apps. However, our data shows clear leaders in each category—Salesforce in sales and marketing, Amazon Web Services in infrastructure, ADP sitting pretty for HR, and Box in content storage—but with so many options and new innovations appearing every day, no one’s spot at the top is safe. Many of our customers have many if not all of these in their stack.
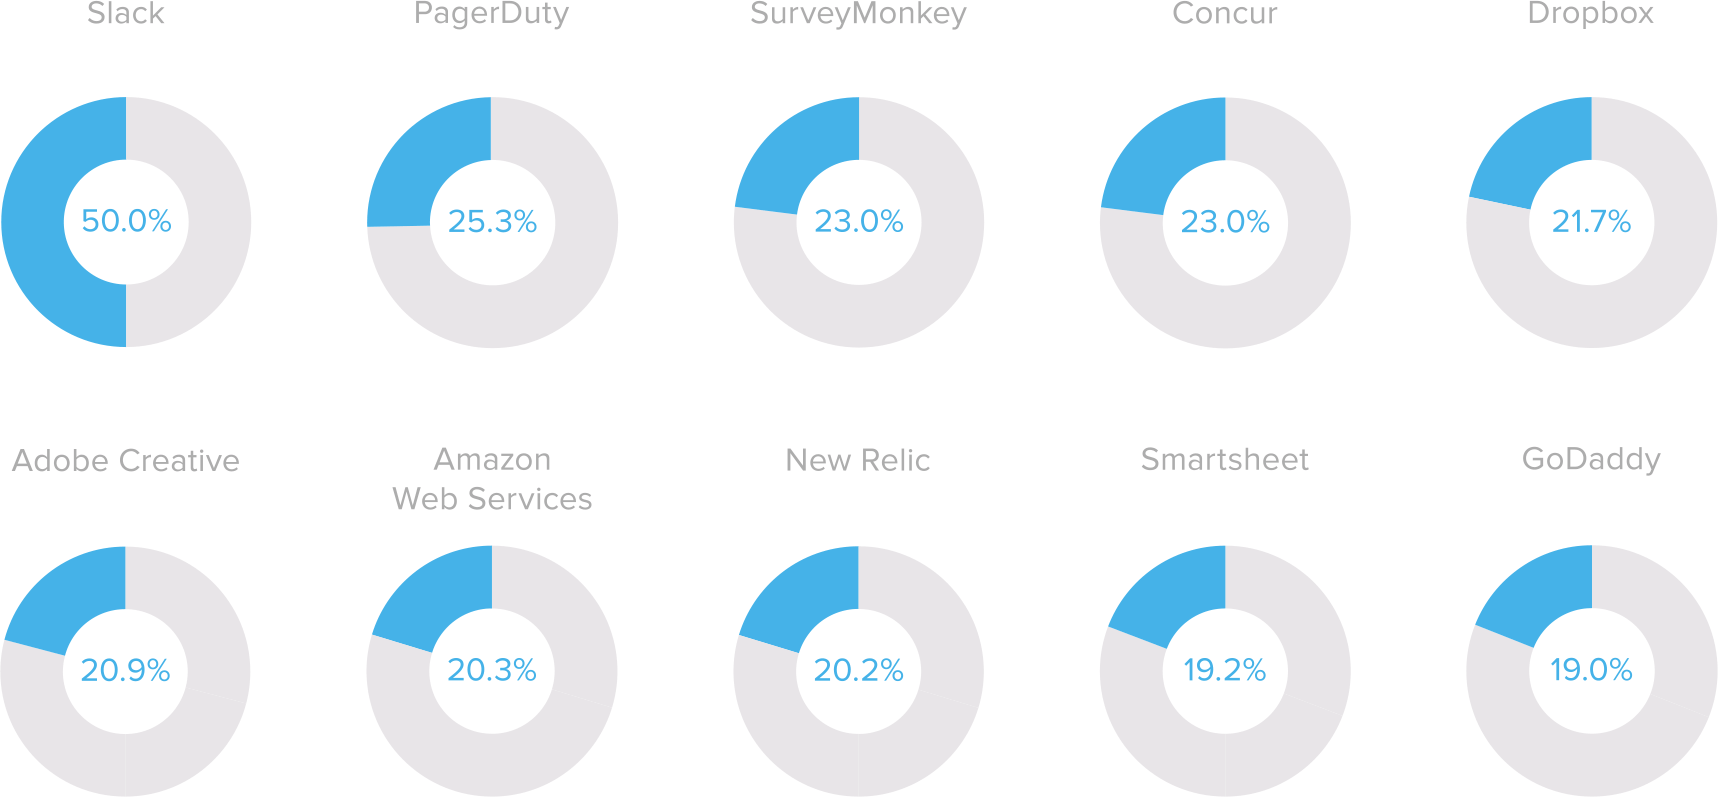
Top Content Storage Apps
Proportion of Top Content Storage Apps by Customer
Top HR Apps
Proportion of Top HR Apps by Customer
Top Marketing Apps
Proportion of Top Sales and Marketing Apps
Top Developer Tool Apps
Proportion of Top Developer Apps by Customer
Where is Google More Popular Than O365?
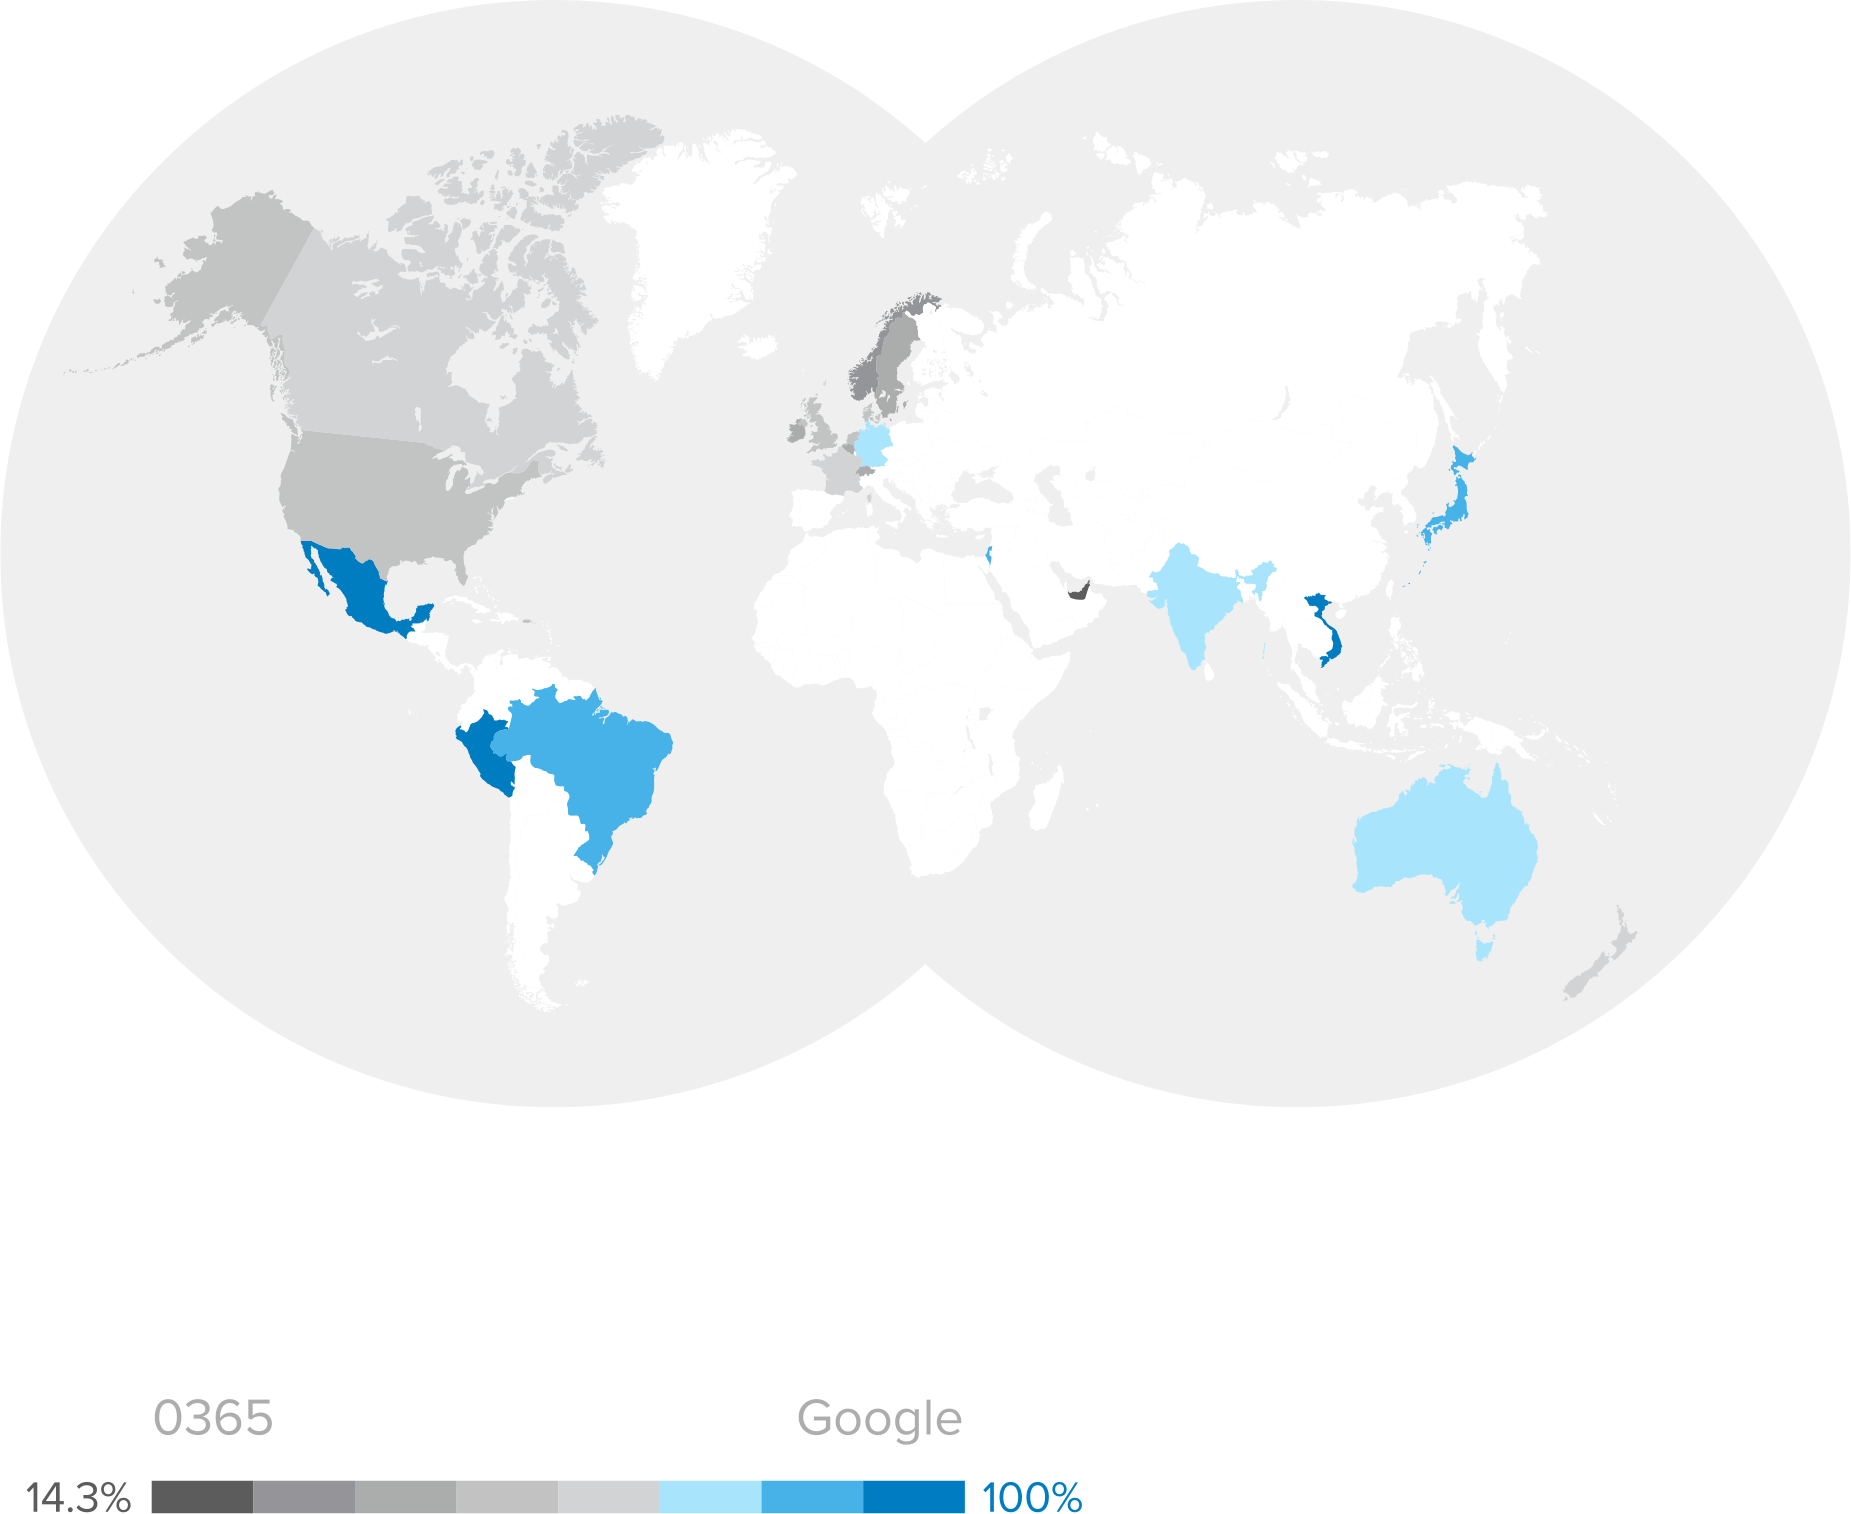
What’s trending in email?
Since bringing on Satya Nadella as CEO, Microsoft has made significant steps to embrace the cloud, encouraging customers to move their email to Microsoft’s cloud with Office 365. We’ve seen the positive results—for Microsoft, at least—of that push in our data, as Office 365 has steadily gained popularity and surpassed Google Apps as the most popular email application. That’s generally the case across our network, with a few exceptions. Google continues to be the email application of choice for small businesses and companies in certain regions, most notably Asia Pacific.
Mobile @ Work
Our formidable investors at Andreessen Horowitz have shown that by 2020, 80 percent of the world will own a smartphone and that “mobile” really means everywhere and everything, not just smartphone or tablet. Okta’s dataset shows what apps people are accessing on mobile and how different industries are using devices.
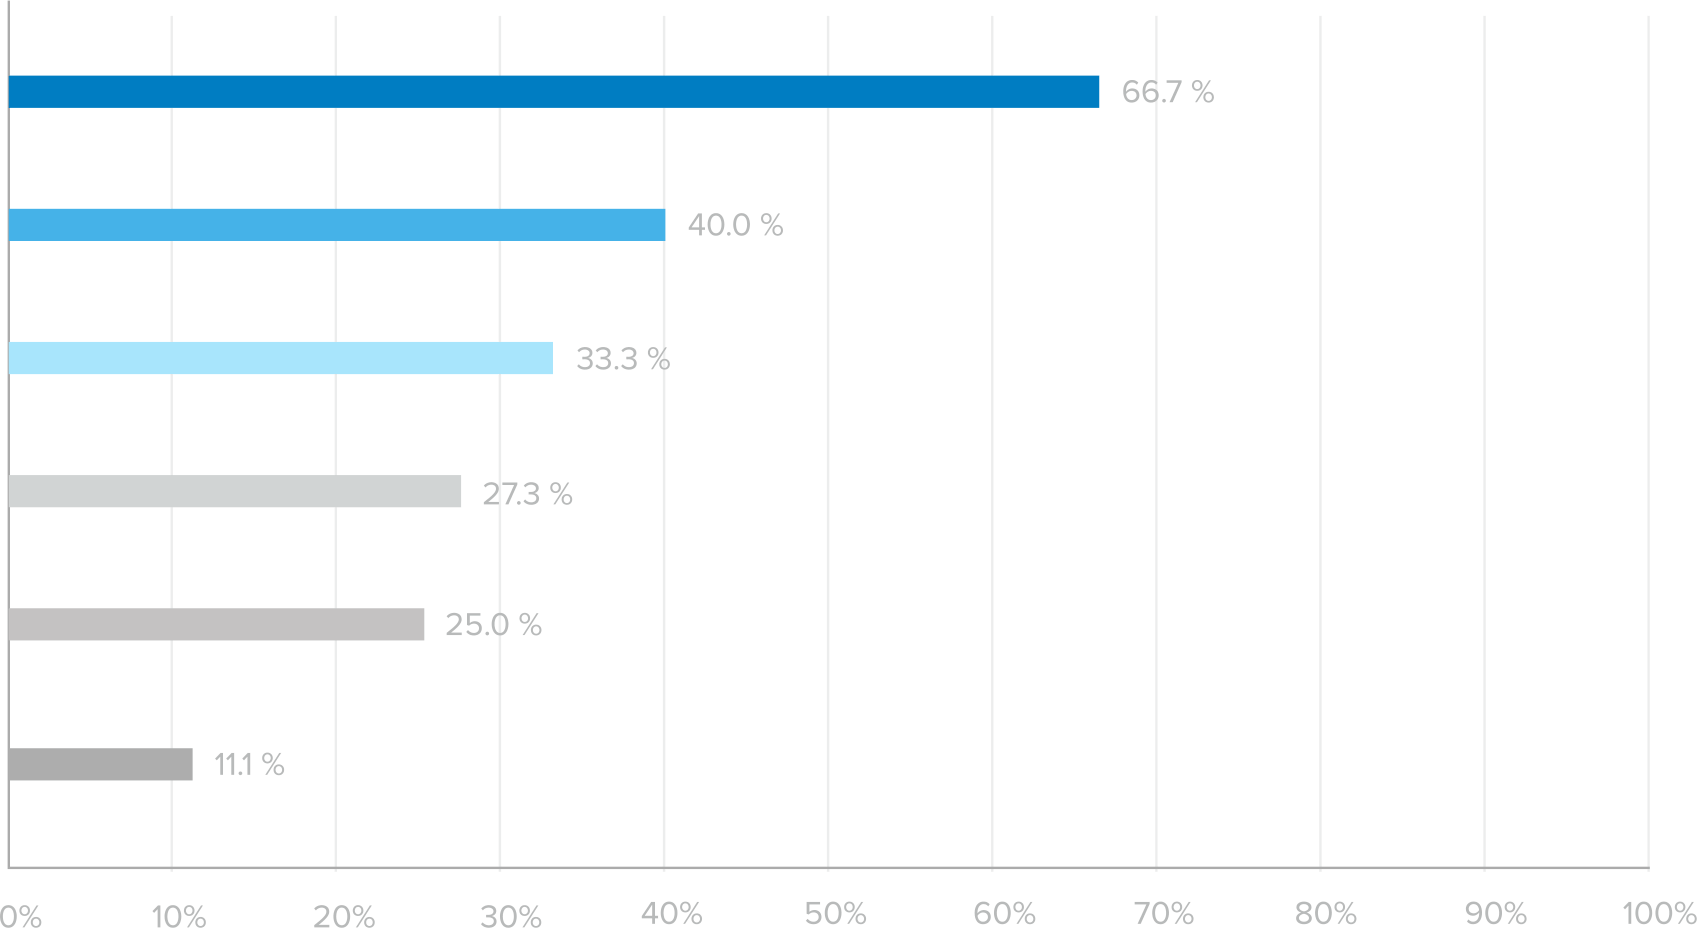
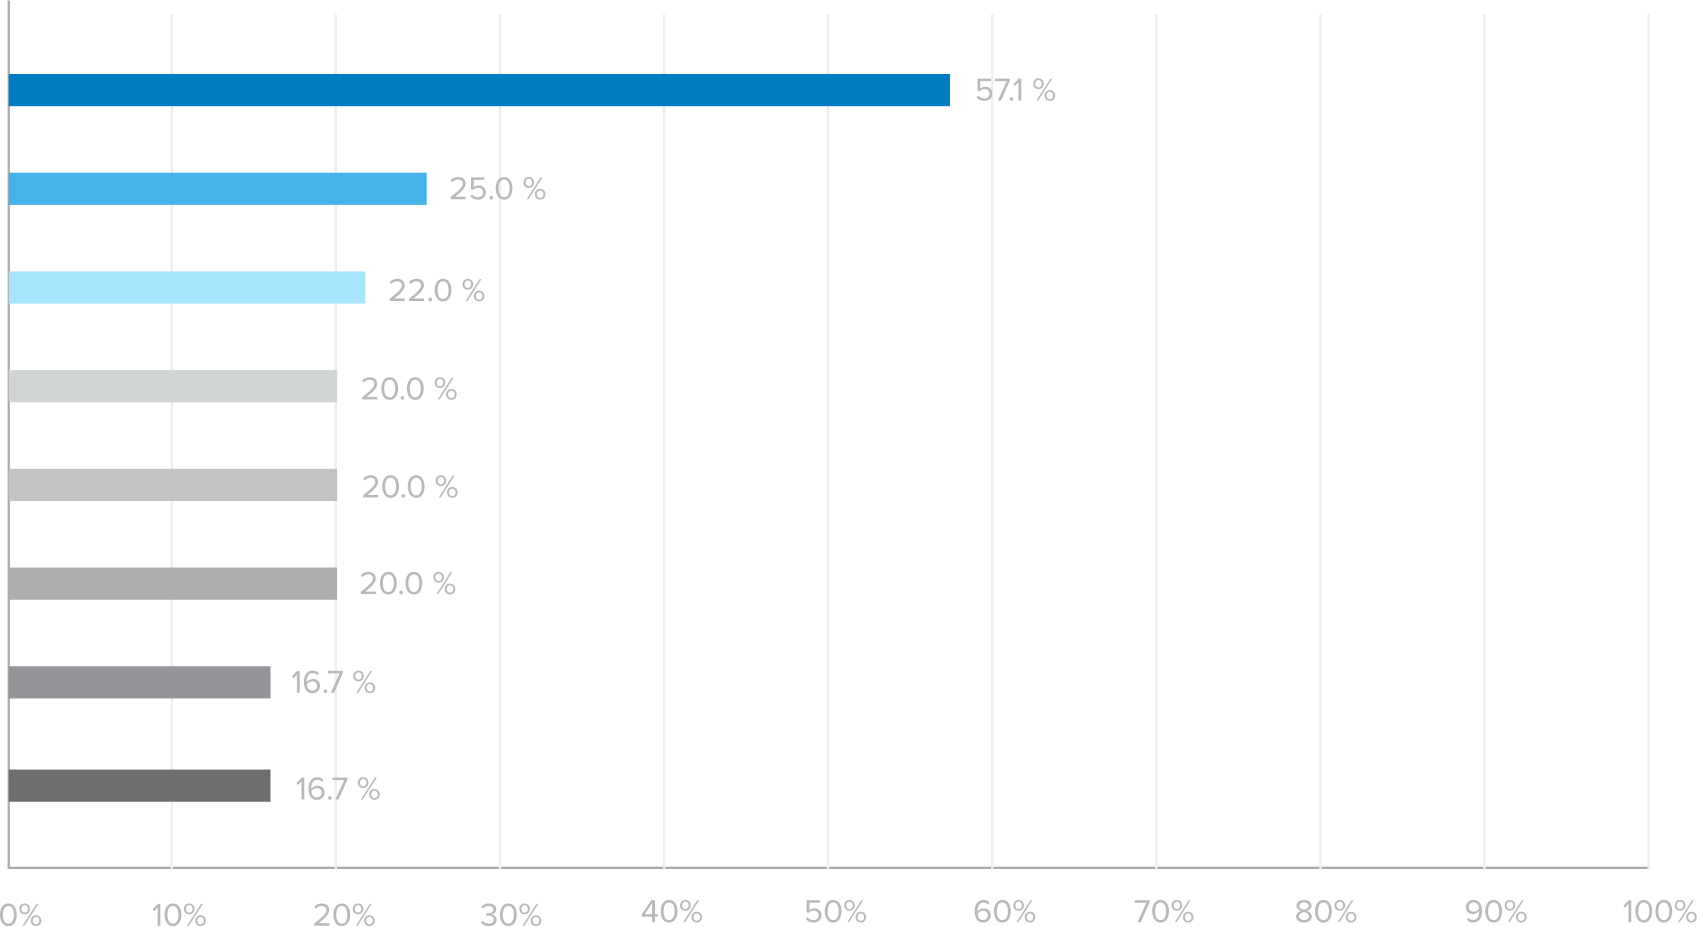
Top Industries by Percentage of End Users on Mobile
Top Regions by Percentage of End Users Logging in on Mobile Devices, Last 30 Days
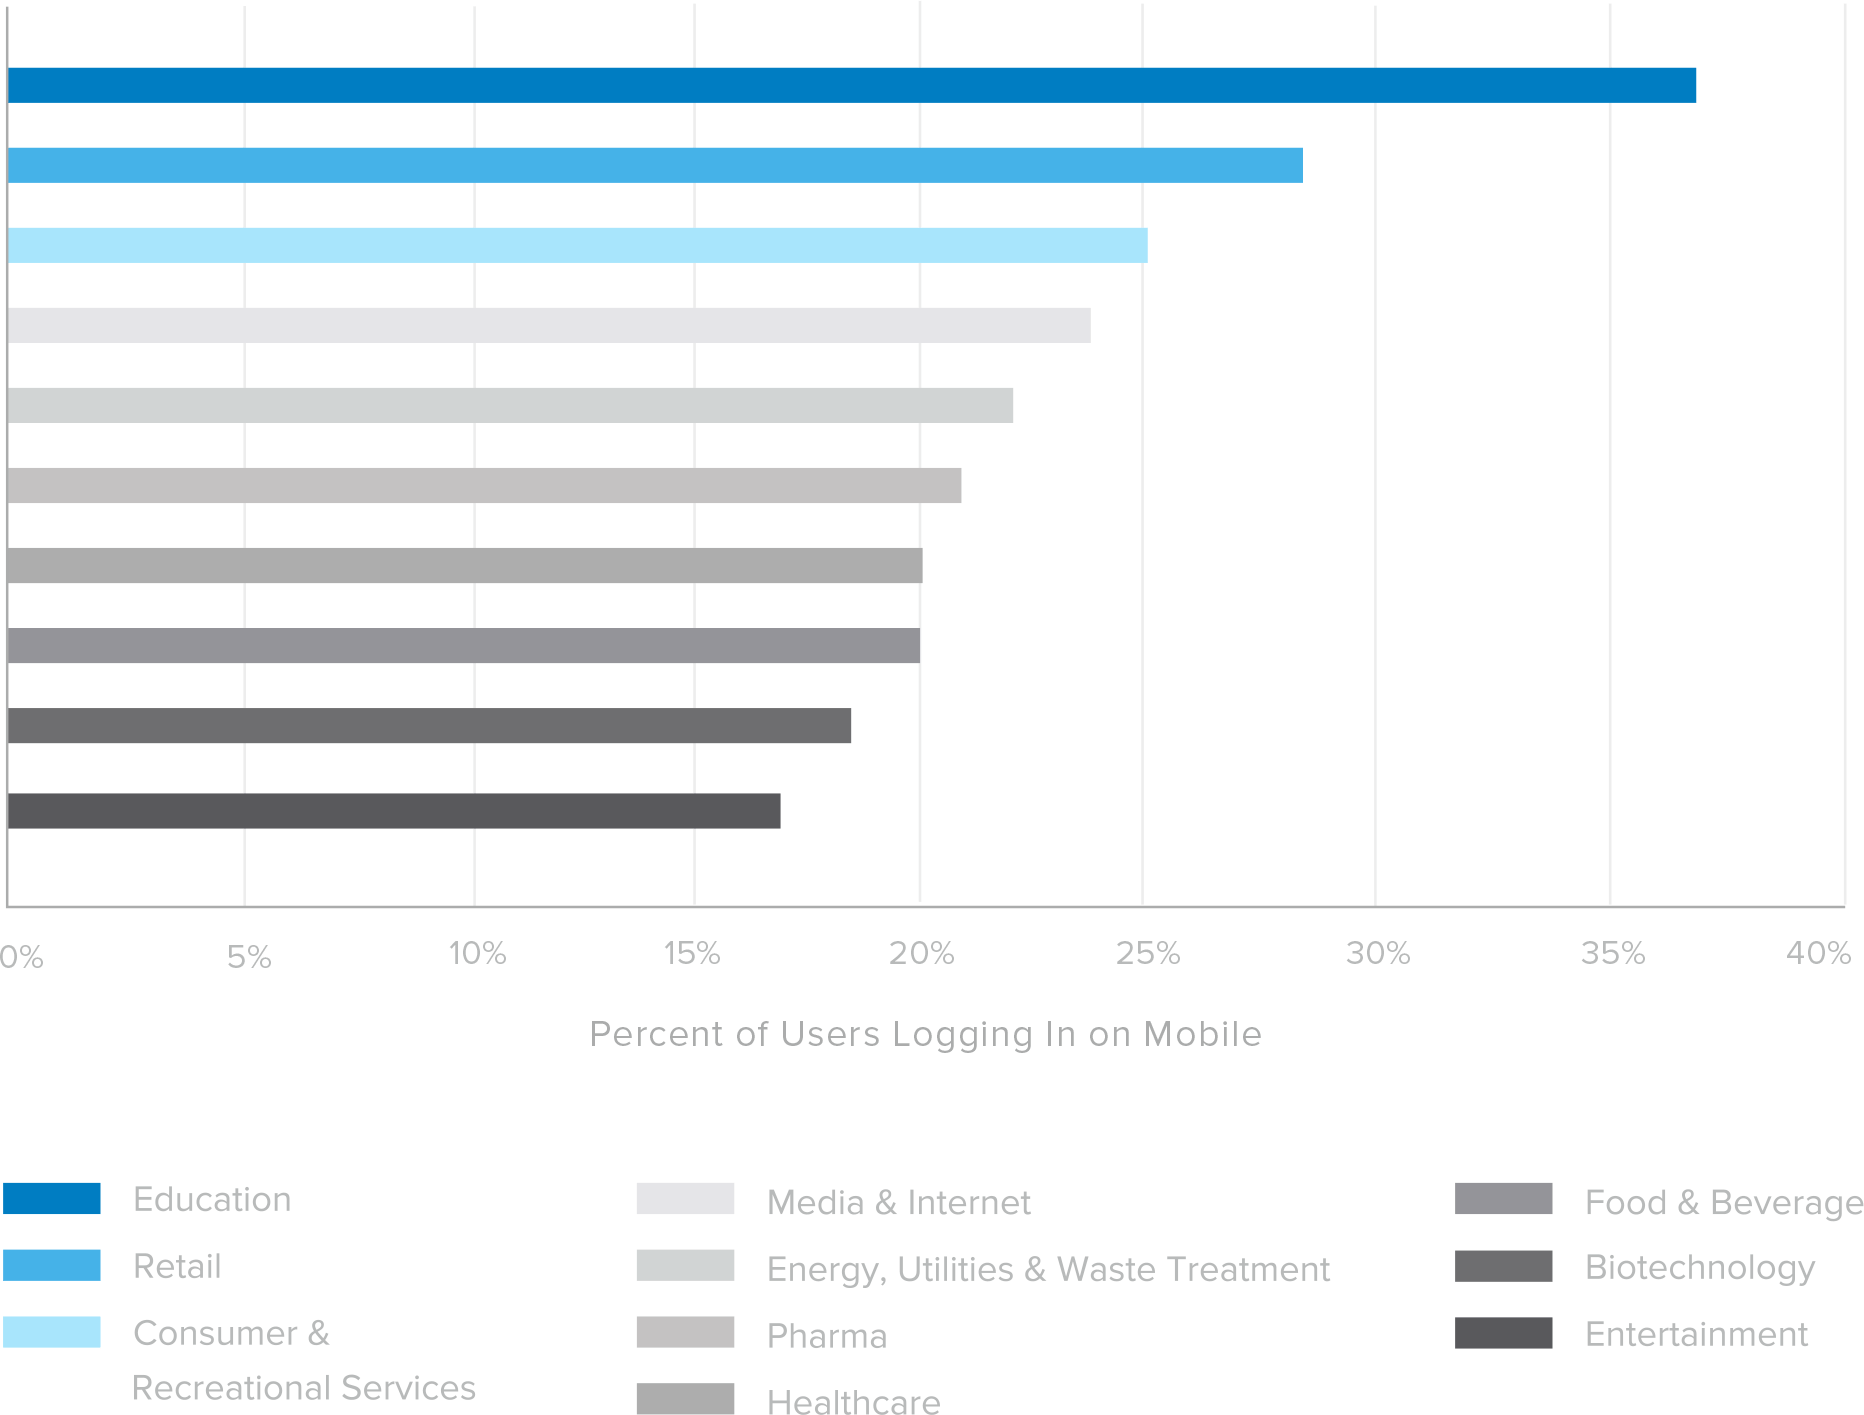
Which industries are leading mobile adoption?
Education and retail have the highest percentage of users accessing applications and data from mobile devices. With decentralized workforces, employees of retail companies and education are more dependent on mobile devices to access applications and email.
Industries Where Users Logged In Only on Mobile Devices
Top Regions by Percentage of End Users Logging in on Mobile Devices, Last 30 Days
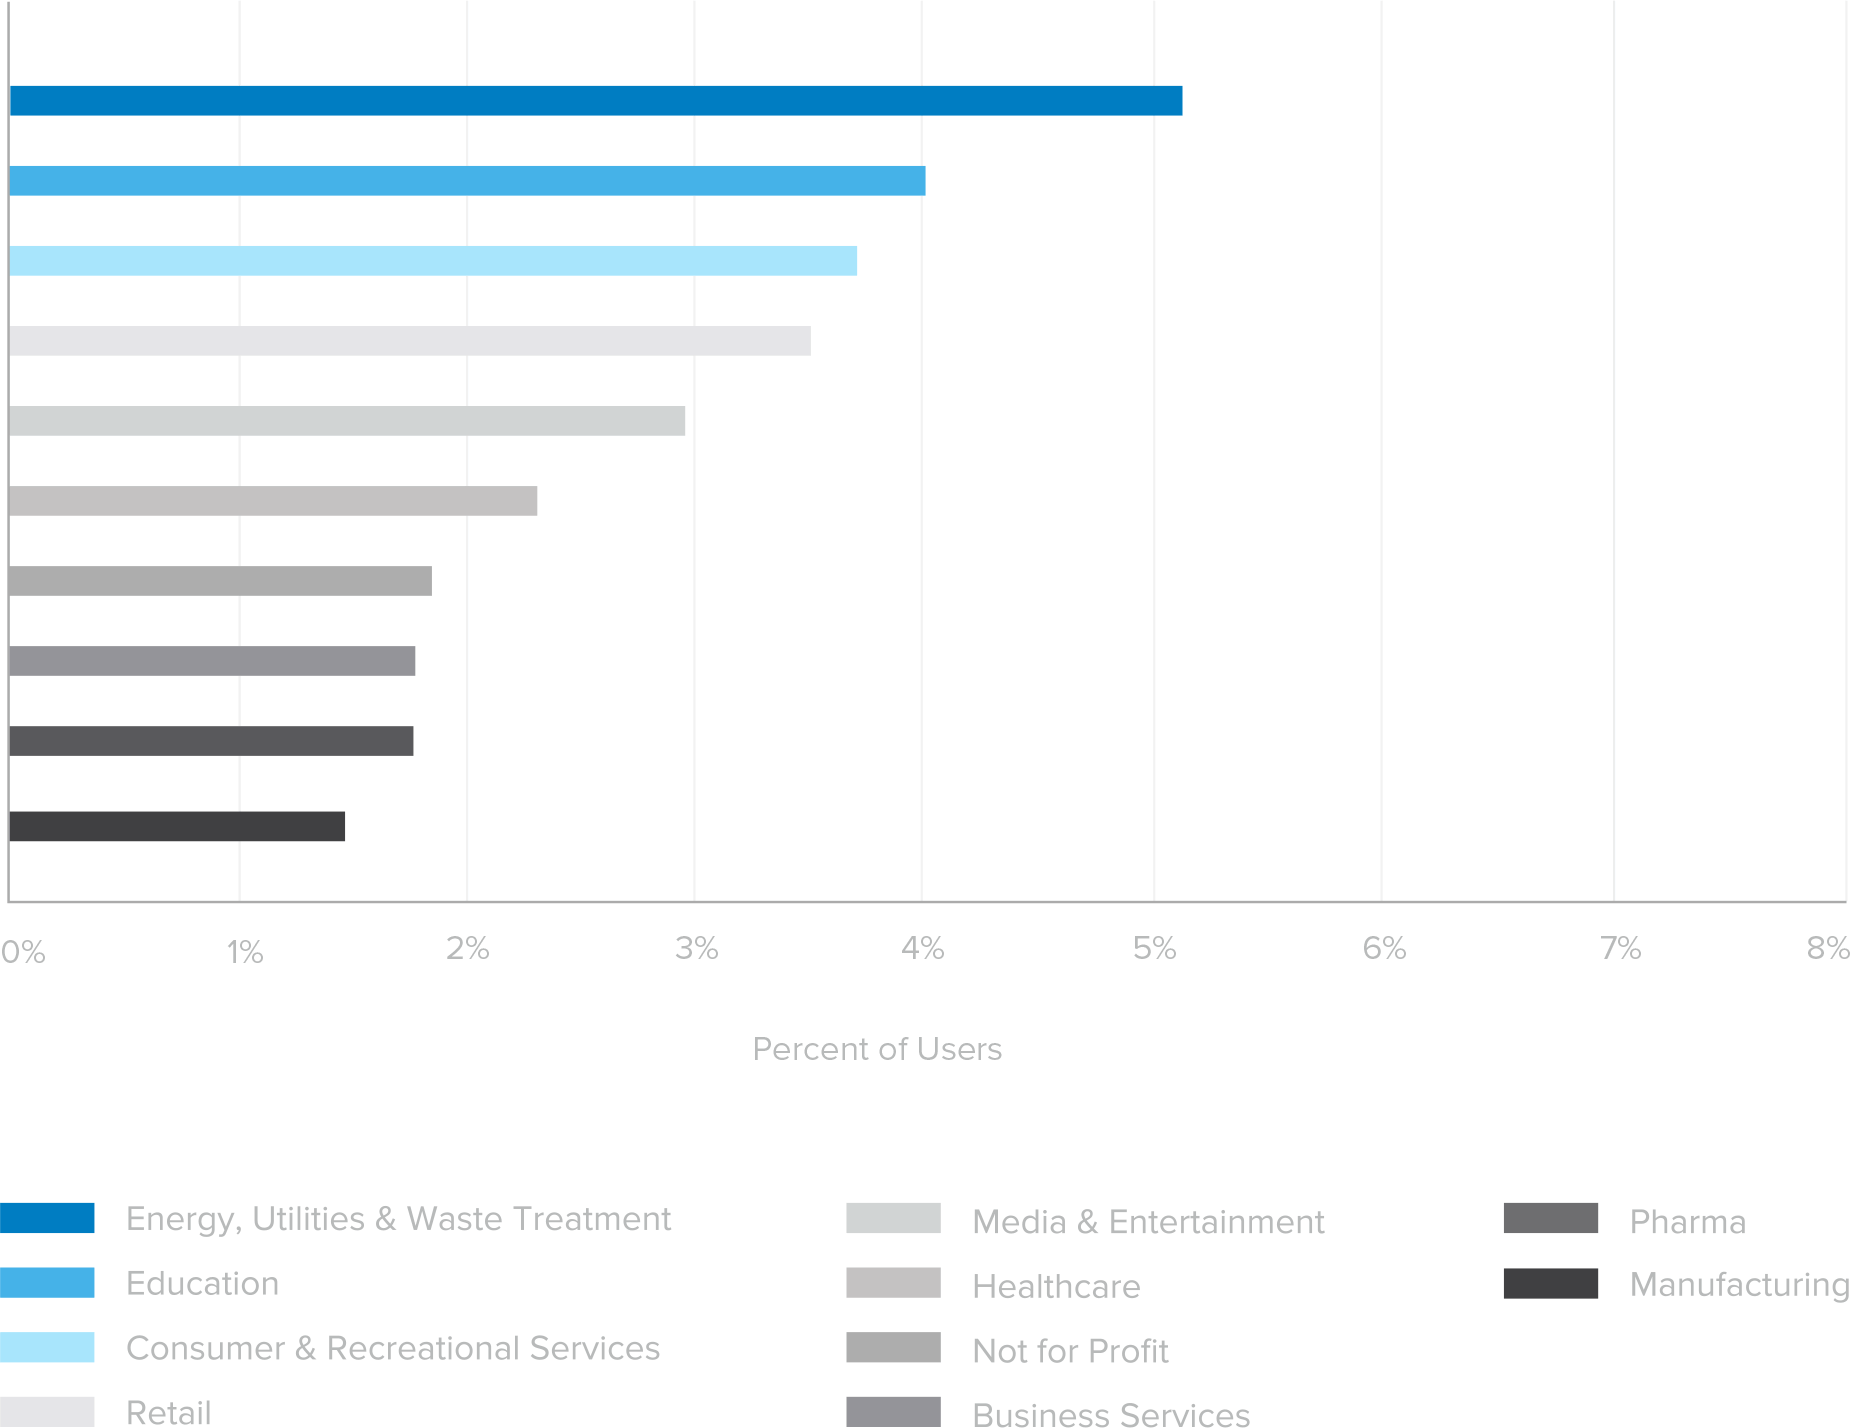
Which industries log on using only mobile?
Although Education and Retail lead the way in general mobile adoption, Energy, Utilities and Waste Treatment surpass other industries in the percentage of end users logging in only with mobile devices. The massive amount of field workers in this industry are driving this trend, depending only on mobile devices to get their work done.
Tablet Usage by Industry
Top Regions by Percentage of End Users Logging in on Mobile Devices, Last 30 Days
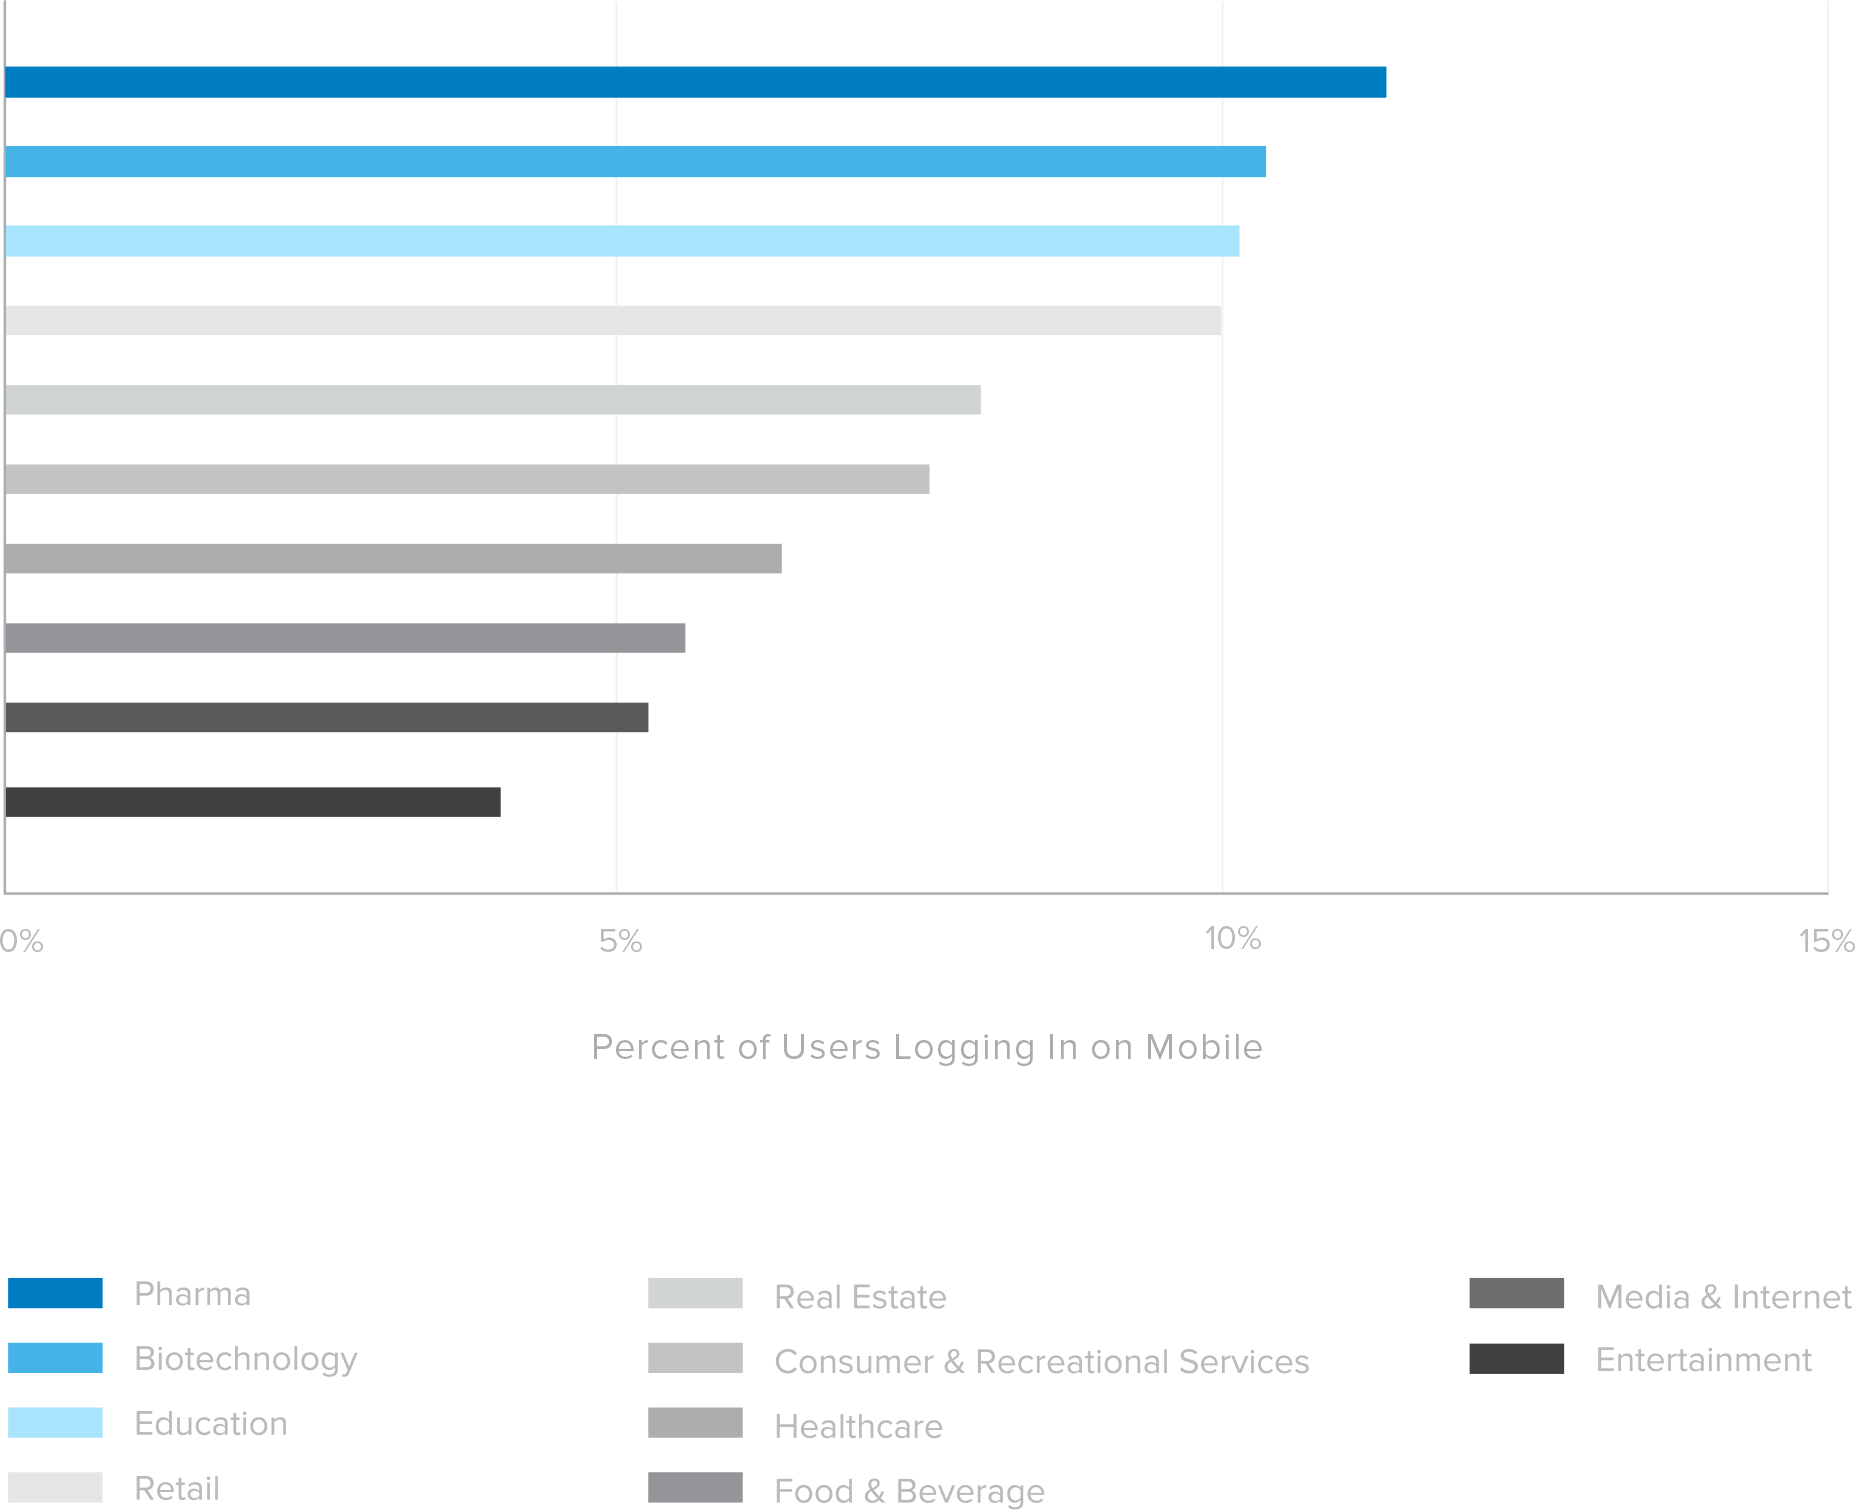
Which industries are leading tablet adoption?
Pharmaceutical companies have large sales teams in the field, and have been one of the fastest industries to arm their sales teams with tablets.
Top Regions by Percentage of End Users Logging in on Mobile
Top Regions by Percentage of End Users Logging in on Mobile Devices, Last 30 Days
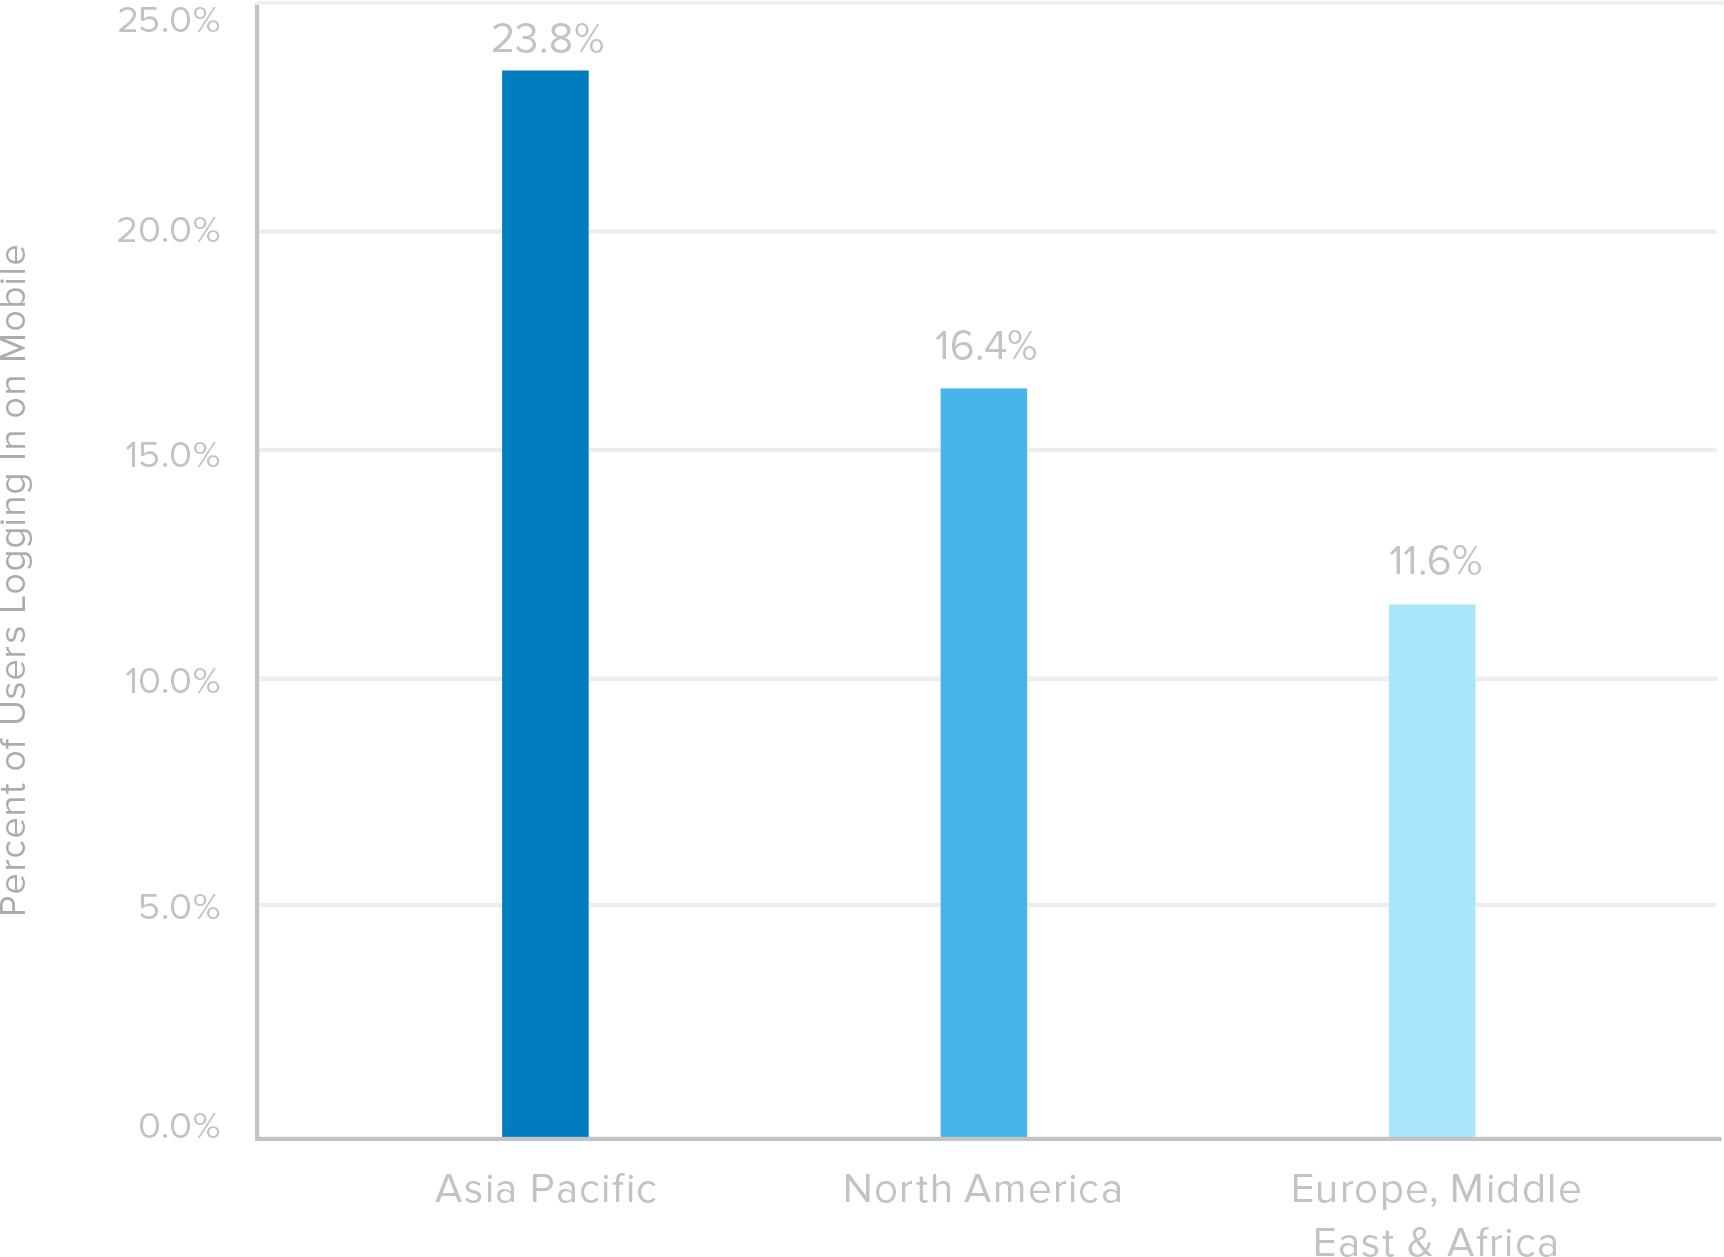
Which regions show the strongest “mobile-only” workforce?
Developing regions such as Asia Pacific show the most adoption of mobile devices both in personal and enterprise usage with an average of 23.8 percent of end users regularly logging into Okta only from mobile devices (as compared to North America’s 16.4 percent and Europe, Middle East & Africa’s 11.6 percent).
Conversely, mobile adoption is lower in Europe, Middle East & Africa, where regulations around personal data privacy and personal device usage are more complicated, and more employees likely only access corporate resources from their company-issued desktop in the office. Note: this dataset does not include Latin America, which would likely also have a strong mobile-only showing.
Security @ Work
Due to the many data breaches and personal information leaks over the past few years, security is top of mind for businesses (if you feel like getting a little paranoid, The New York Times offers a fairly comprehensive list of major breaches). Okta alliance partner Accenture’s report “Growing the Digital Business: Accenture Mobility Research 2015” shows that 51 percent of nearly 2,000 senior decision-makers questioned are concerned about security as a challenge for adopting digital technologies. Okta’s data also affirms that businesses are rapidly adding security measures to protect access to the sensitive data that employees are putting into cloud applications and services, and often accessing from mobile devices like smartphones and tablets. What’s more, Okta’s data shows that businesses are moving toward leveraging authentication methods that are easy to use and more secure, and moving away from the traditional security questions—“What’s your mother’s maiden name?” or “What was your high school mascot?”—as a second form of verification.
Apps Most Commonly Protected by App-Level MFA
Proportion of App-Level MFA Enabled by Number of Customers
What are the most popular applications to protect with multi-factor authentication?
Businesses have traditionally protected VPN gateways with a second factor to authenticate users, and as mission-critical infrastructure moves to the cloud, companies also secure access with multi-factor authentication. As organizations put more and more sensitive data in cloud-based apps—such as email content in Office 365, sales data in Salesforce.com and employee information in Workday—companies increasingly bring on multi-factor authentication to ensure it’s only being accessed by approved stakeholders.
How fast are businesses adopting MFA?
2014 was a banner year for data breaches, in fact there was a 46 percent increase in data breaches year over year. Data protection has long been an afterthought for businesses, but now that the leakage of sensitive information can affect the bottom line, businesses are making investments in additional security factors. That’s why we have seen multi-factor authentication adoption increase in Okta’s dataset by 40 percent in 2015. Coincidence that data breaches and MFA are growing at a similar rate? We think not. This includes both Okta’s MFA products as well as other vendor products. As breaches continue to happen and enterprises look to meet compliance requirements, we expect the adoption of multi-factor authentication to continue.
Okta has seen a 40 percent increase year over year in companies protecting their sensitive data with multi-factor authentication.
Trend of Verification Factors by Percent of Users
Percent Total Users by Customer Over Time
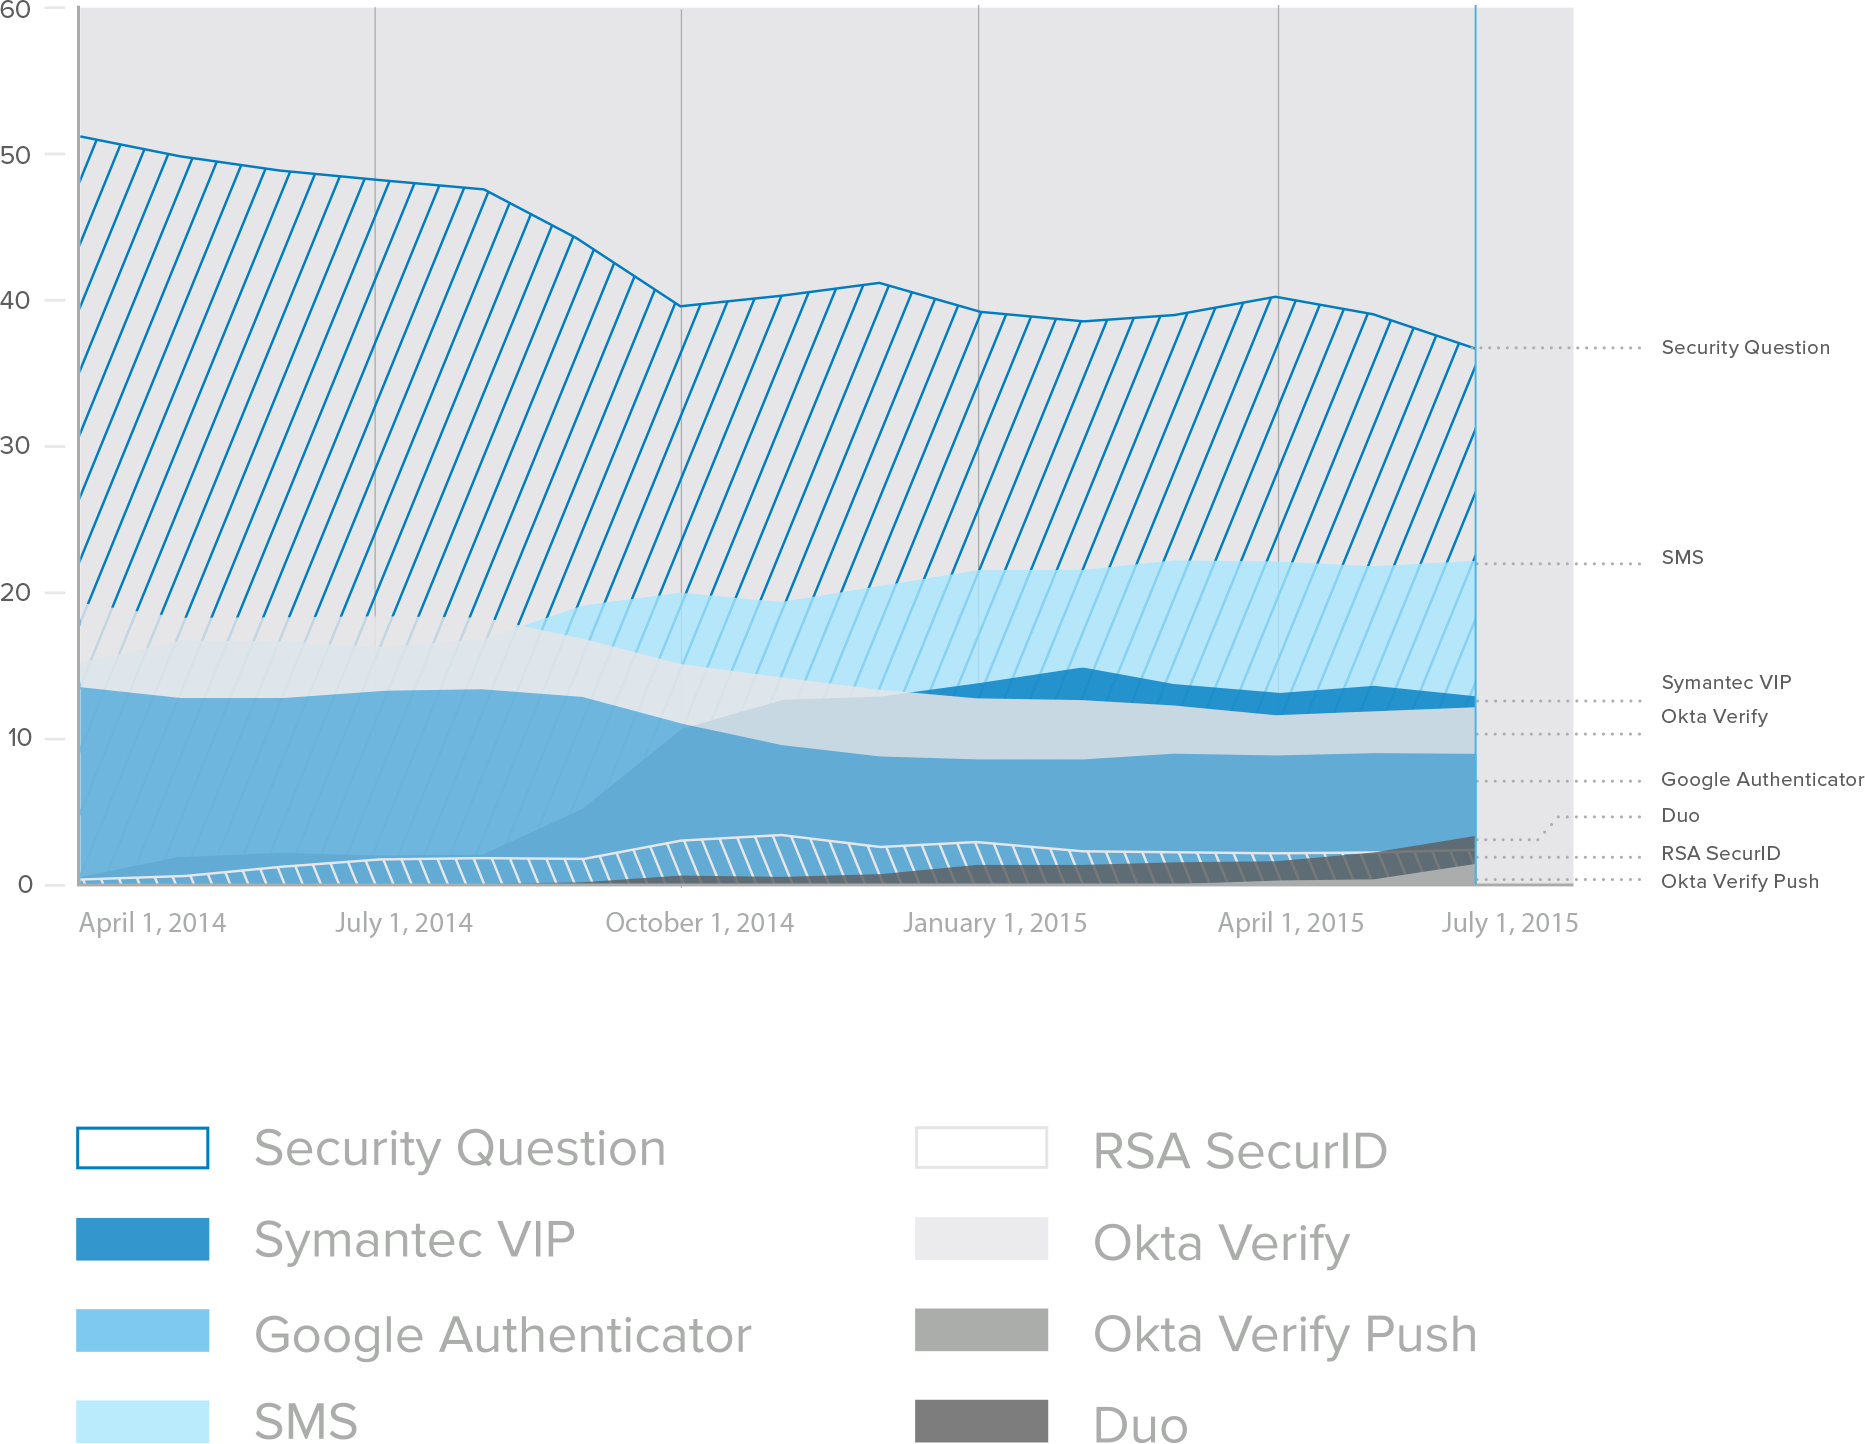
What are the most popular forms of user verification?
Today, the most popular form of user verification remains the security question. If you’ve ever logged into a bank account online, you’ll be familiar with the typical question prompts: “What was your first grade teacher’s name?” and “What year was your father born?” Unfortunately, these questions–and sometimes even their answers–are often difficult to remember and tricky to enter on mobile devices. In addition, the advent of social media has made it easier for hackers to triage personal information to answer those security questions. We’re now seeing the security question decline in favor of simpler and more secure methods.
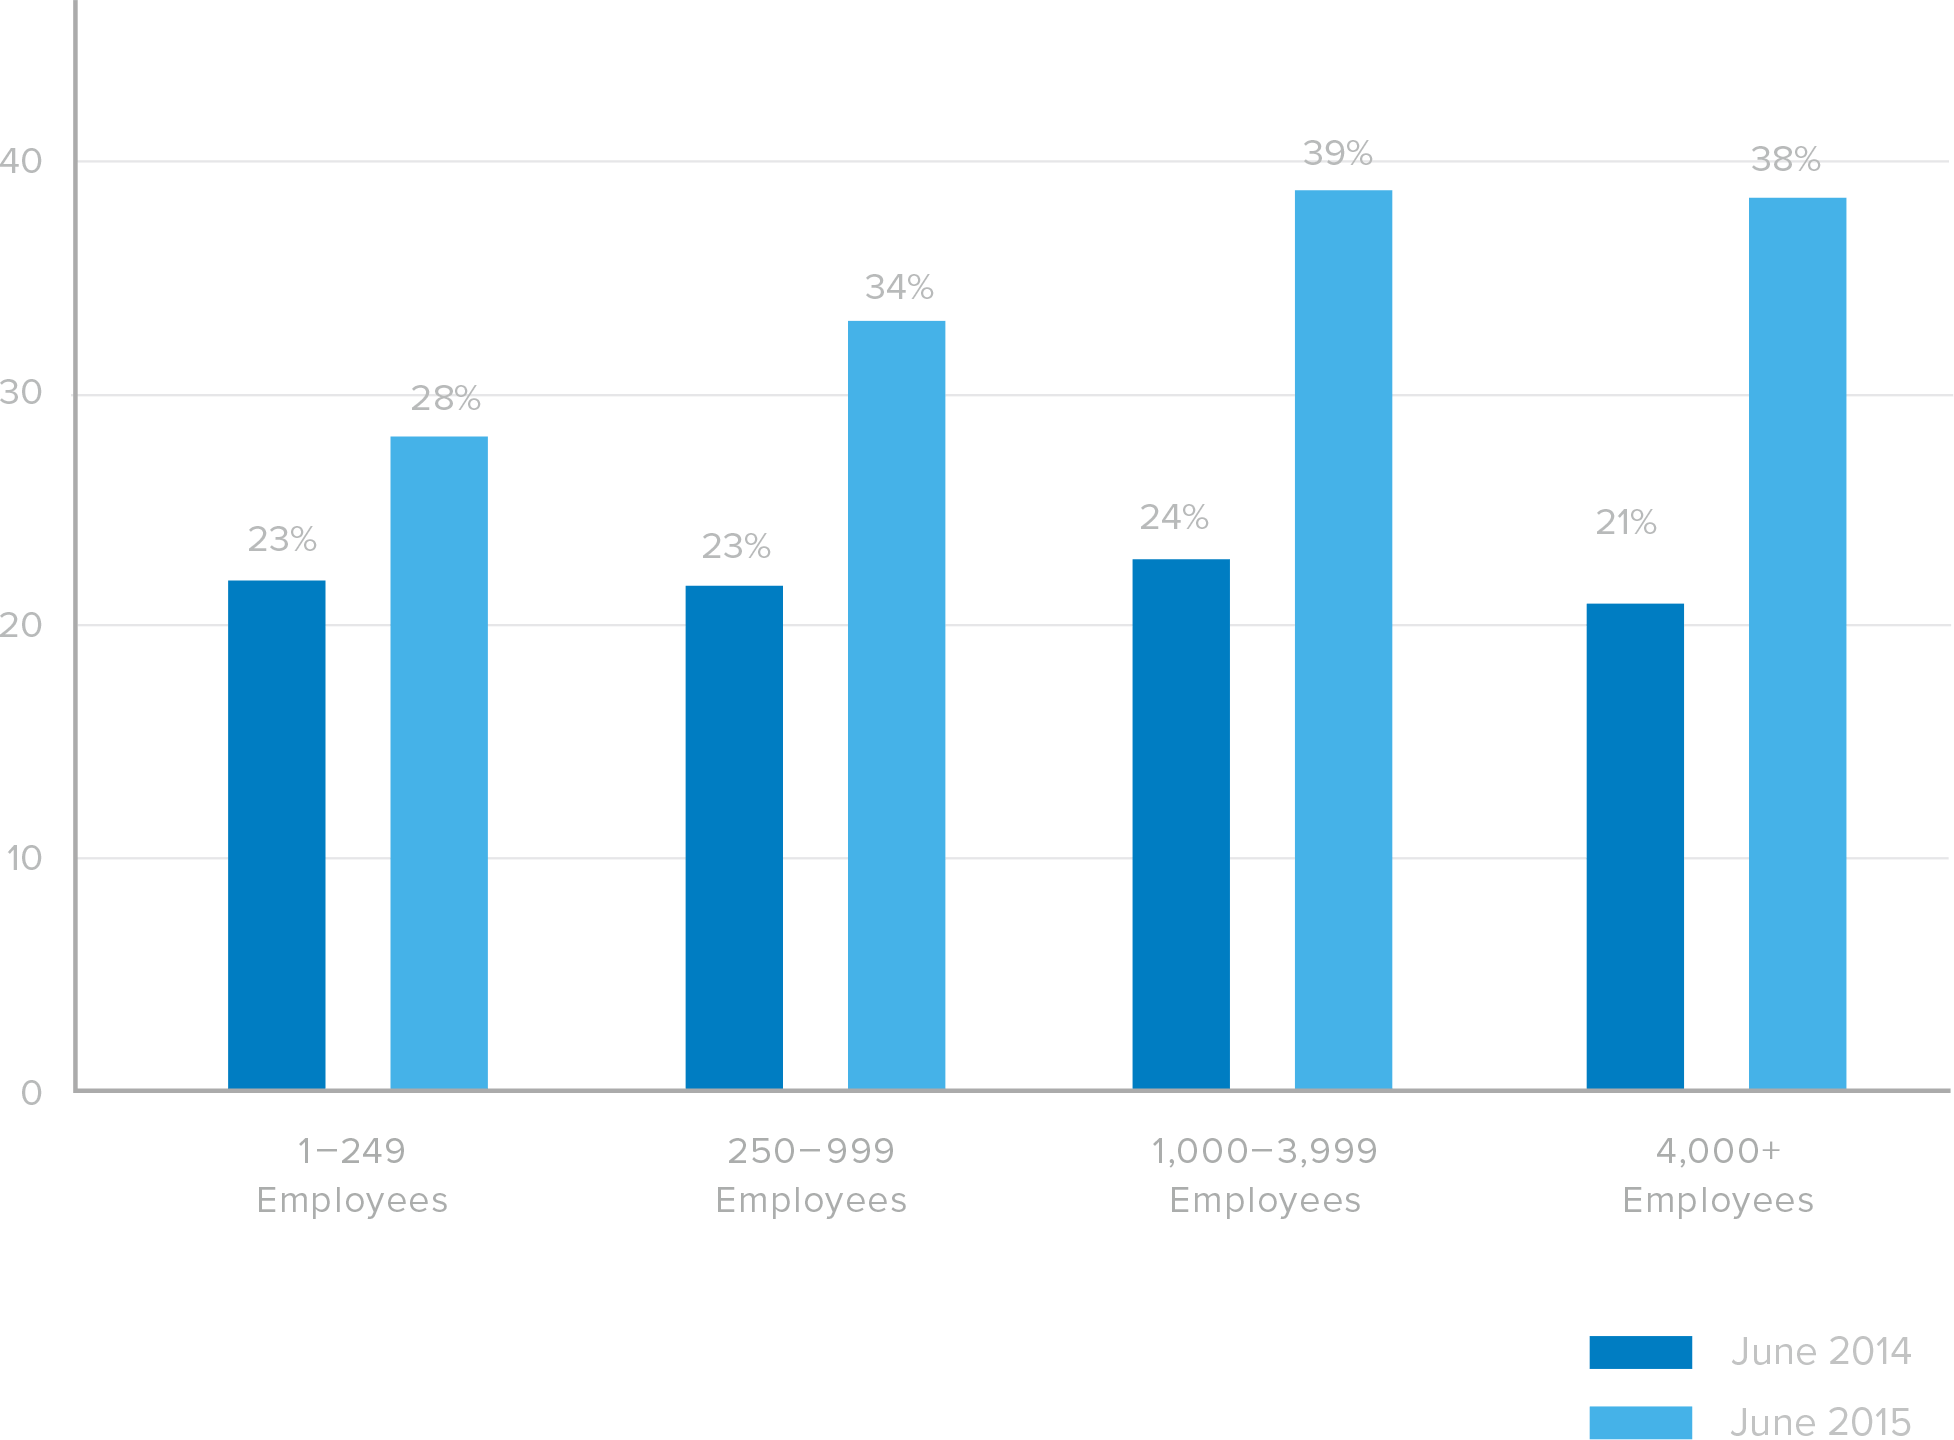
Growth in Percentage of Customers Using MFA by Size
What size companies and what regions use multi-factor authentication?
The cloud is democratizing MFA for companies of all sizes. Traditionally, MFA solutions were purpose built for large enterprises. But with cloud-based solutions, we're seeing just as much adoption in the smaller companies as we are in the large ones. Okta customers across all geographies and company sizes protect applications and infrastructure with multi- factor authentication. Large US-based companies are the biggest users, but international customers and smaller companies also deploy multi-factor authentication more broadly now as the costs and risk of a breach increase year over year.
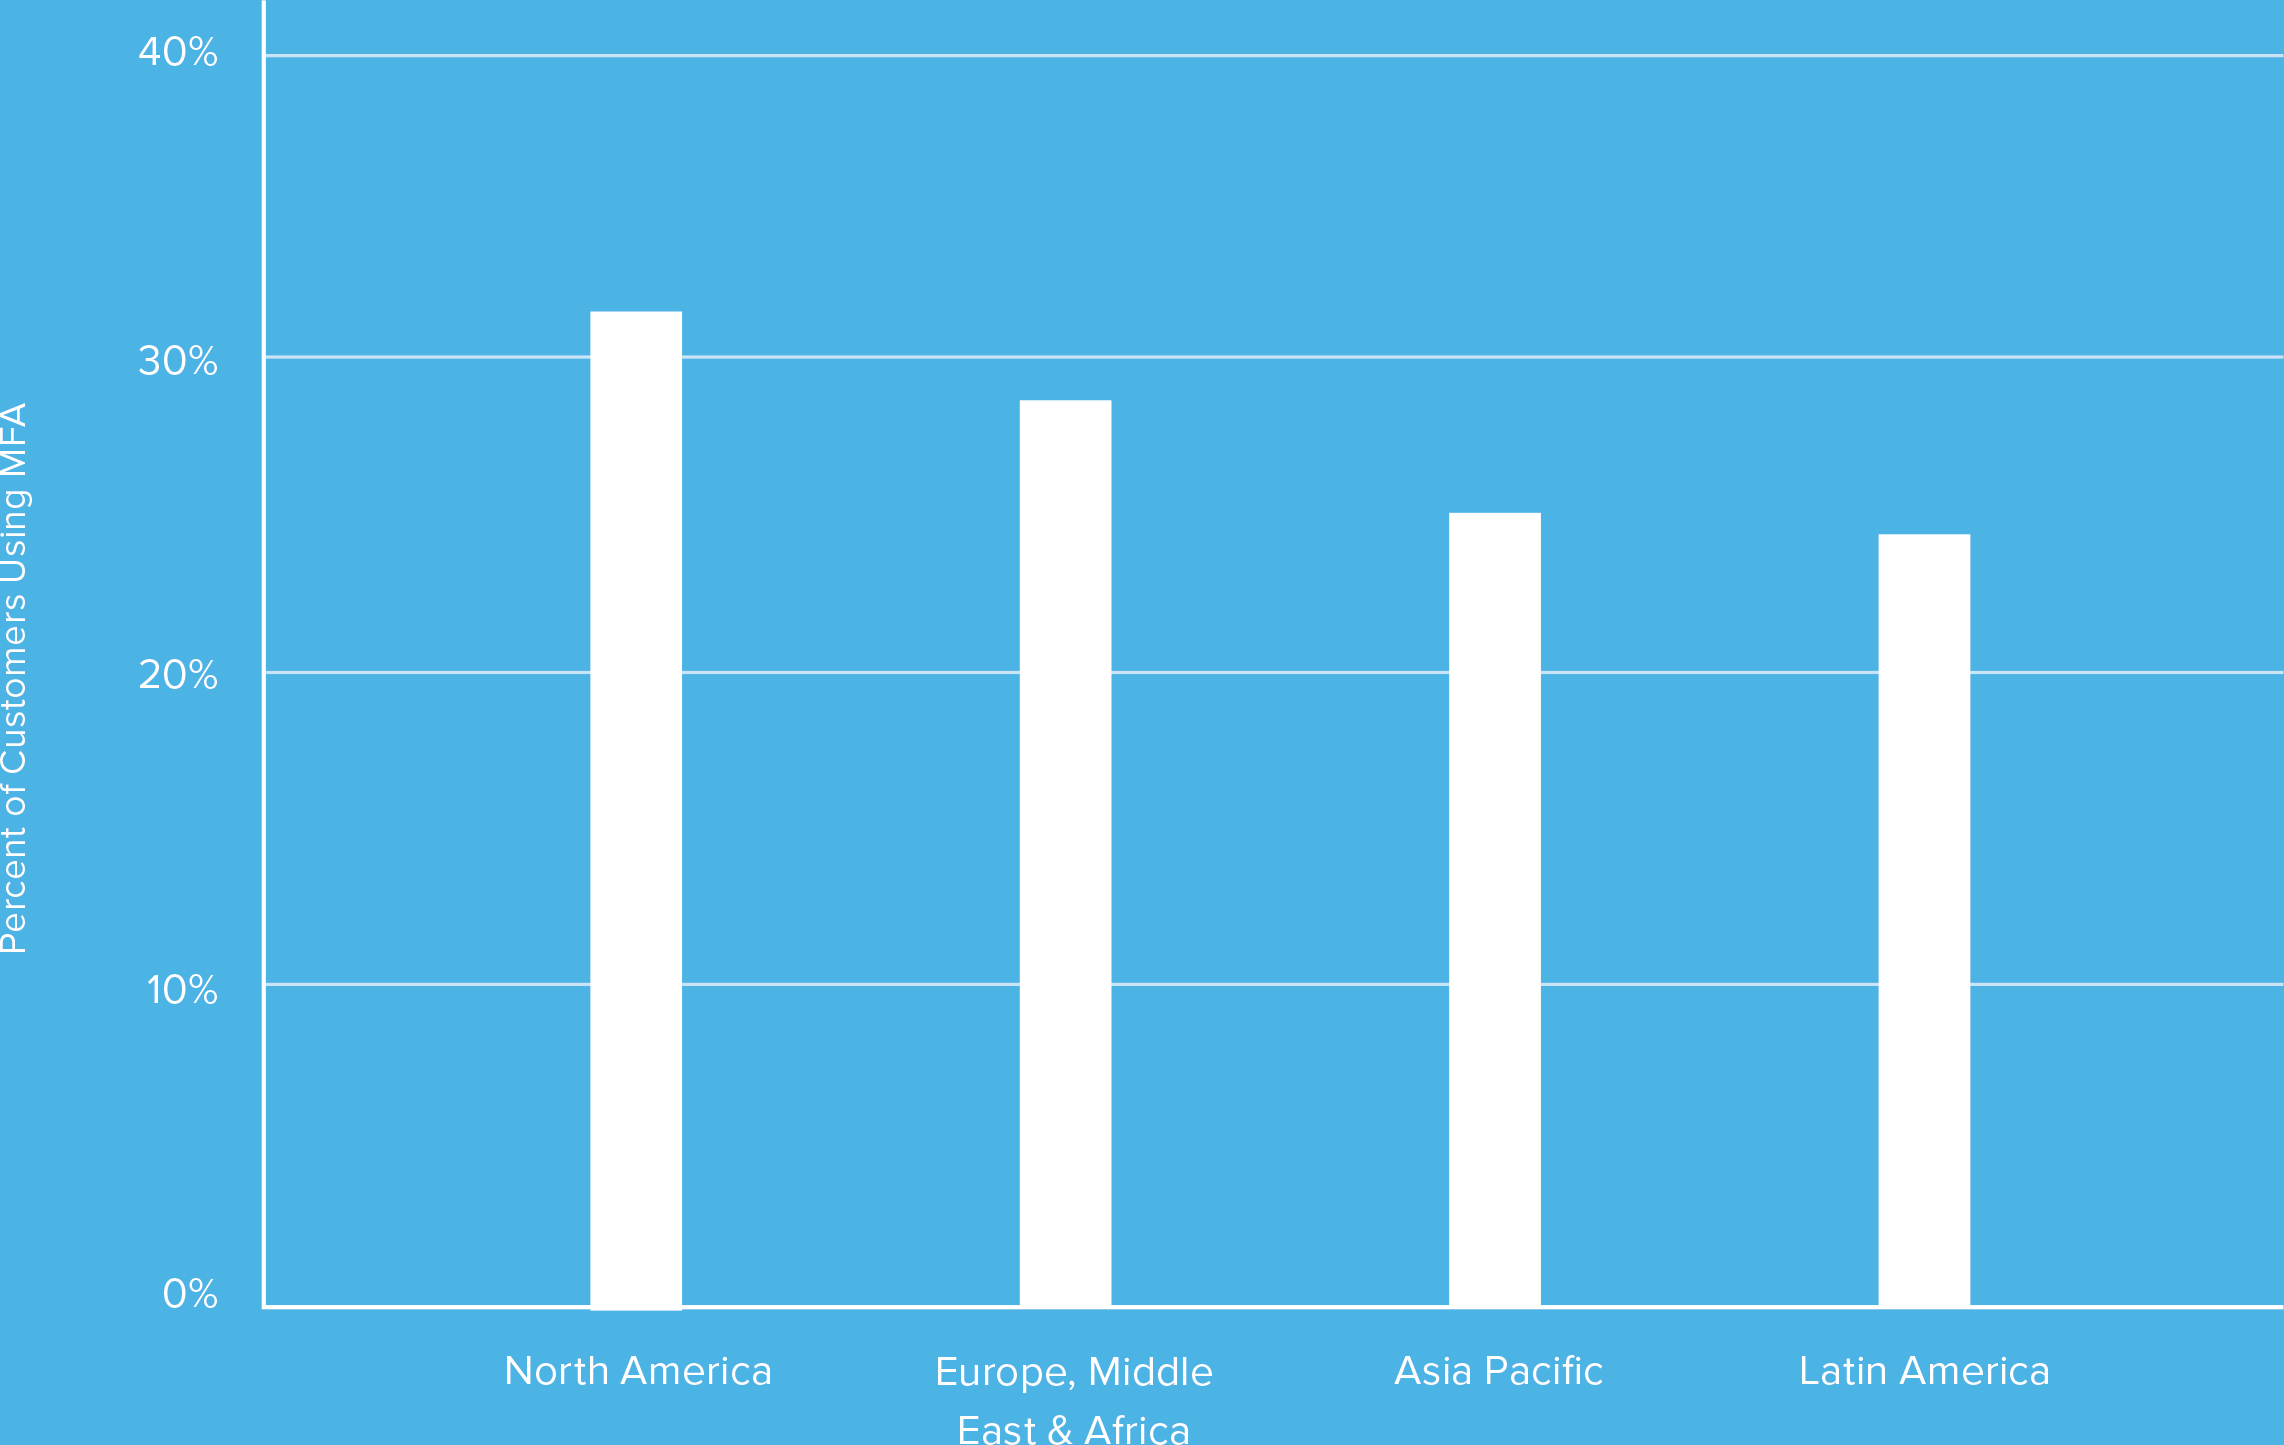
Percentage of Customers Using MFA by Region
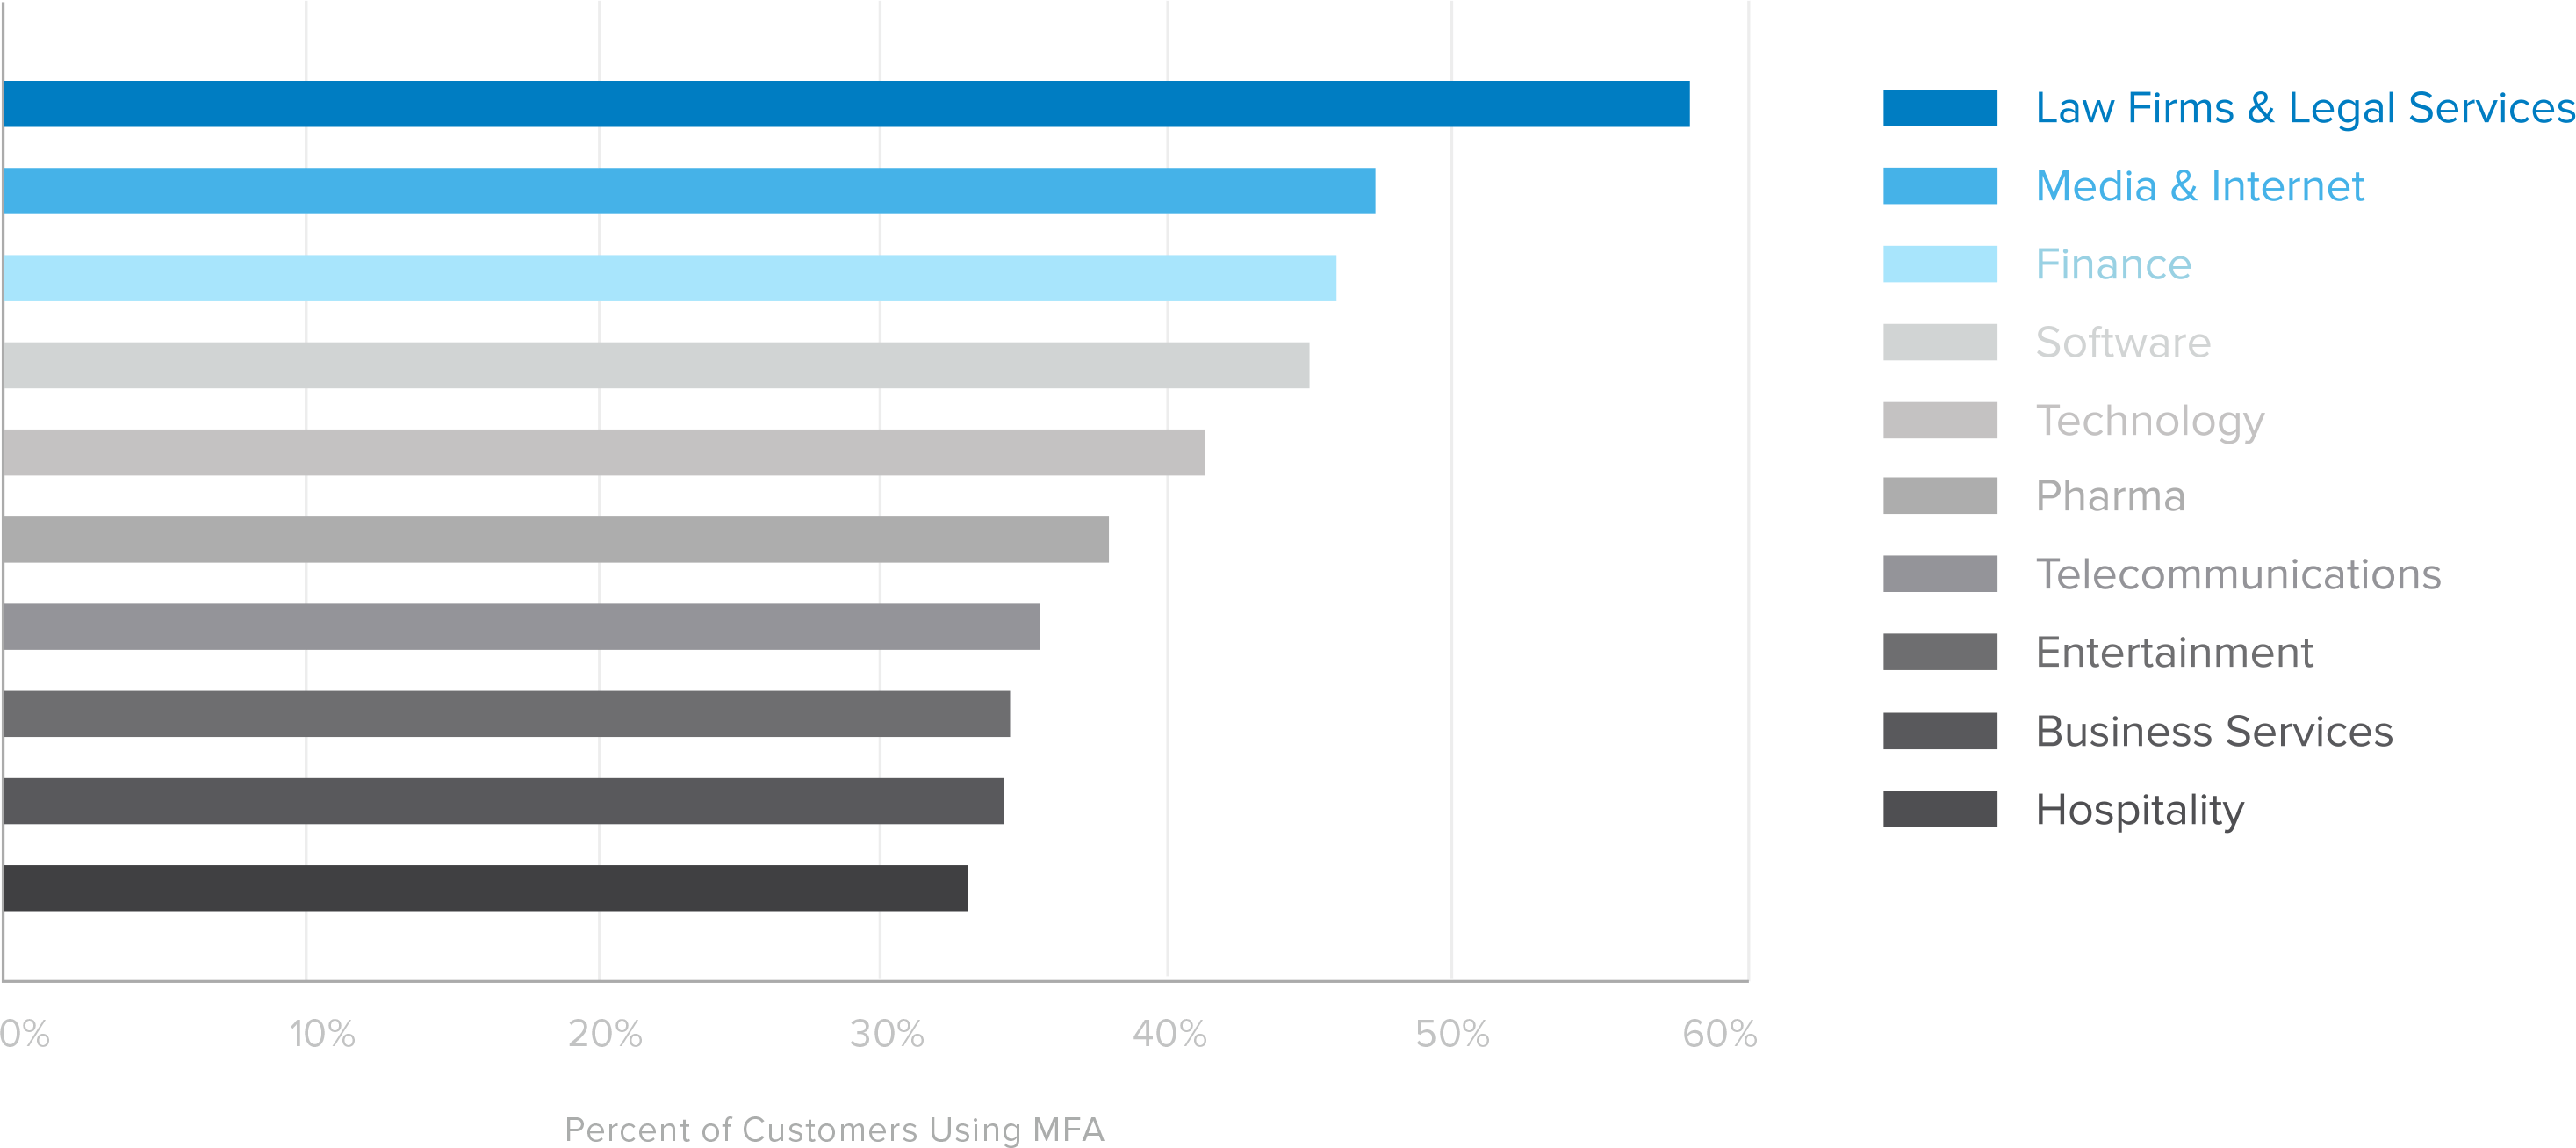
Percentage of Customers Using MFA by Industry
Percentage of Customers Using MFA in June 2015 by Industry
What industries use multi-factor authentication?
According to our data, highly regulated industries such as law firms and finance are the top industries employing multi-factor authentication. Okta’s dataset shows that as more data is moved into the cloud and remote access of that data is required, diverse industries are adopting multi-factor authentication to achieve strong authentication and user verification.
How are developers securing enterprise applications?
Due to increased breaches, the security and privacy of your data—including your credentials (usernames and passwords)—is top of mind for developers as they build the applications you use at work. Over the past two years, we’ve seen the rapid adoption of security standards as developers seek to build safe and secure applications that meet the needs of the enterprise.
To allow users to login to their applications through single-sign on or password management tools, developers have typically leveraged one-factor authentication (username, password, security question) to protect their applications. Over the past two years, Okta’s dataset shows the rapid growth—614 percent—of enterprise applications built with SAML, a highly secure authentication mechanism. SAML uses single-use, expiring tokens to exchange authentication and authorization data between a trusted identity provider and an application, and eliminates the need for people using the service to remember their usernames and passwords.
The digital transformation of businesses has been well-documented by our partner Accenture. Businesses are rapidly adopting digital technologies, not just for their employees, but to provide value to their partners, engage their customers and add revenue streams. Okta’s dataset shows that as businesses deliver digital technologies, they are becoming responsible for more data than ever, and many businesses are moving their critical infrastructure to the cloud.
Growth of SAML Apps in Catalogue
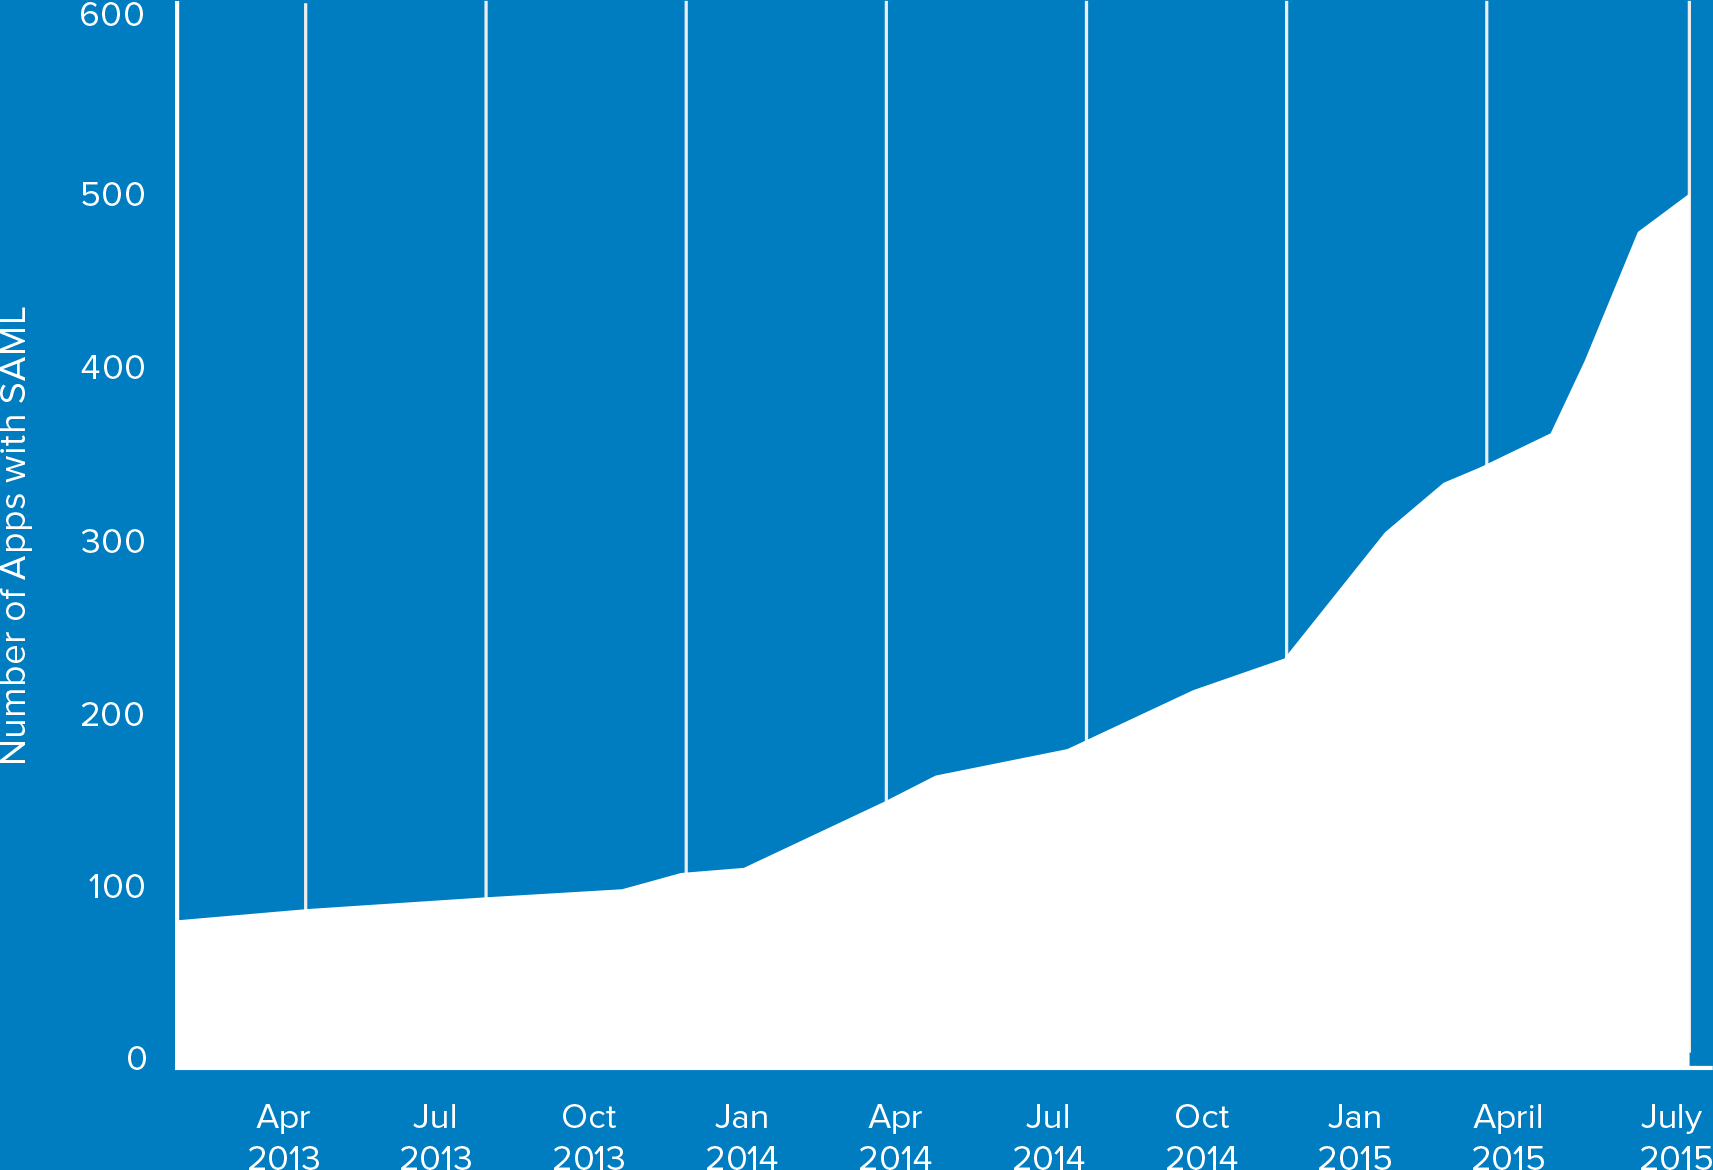
Why are developers using SAML more?
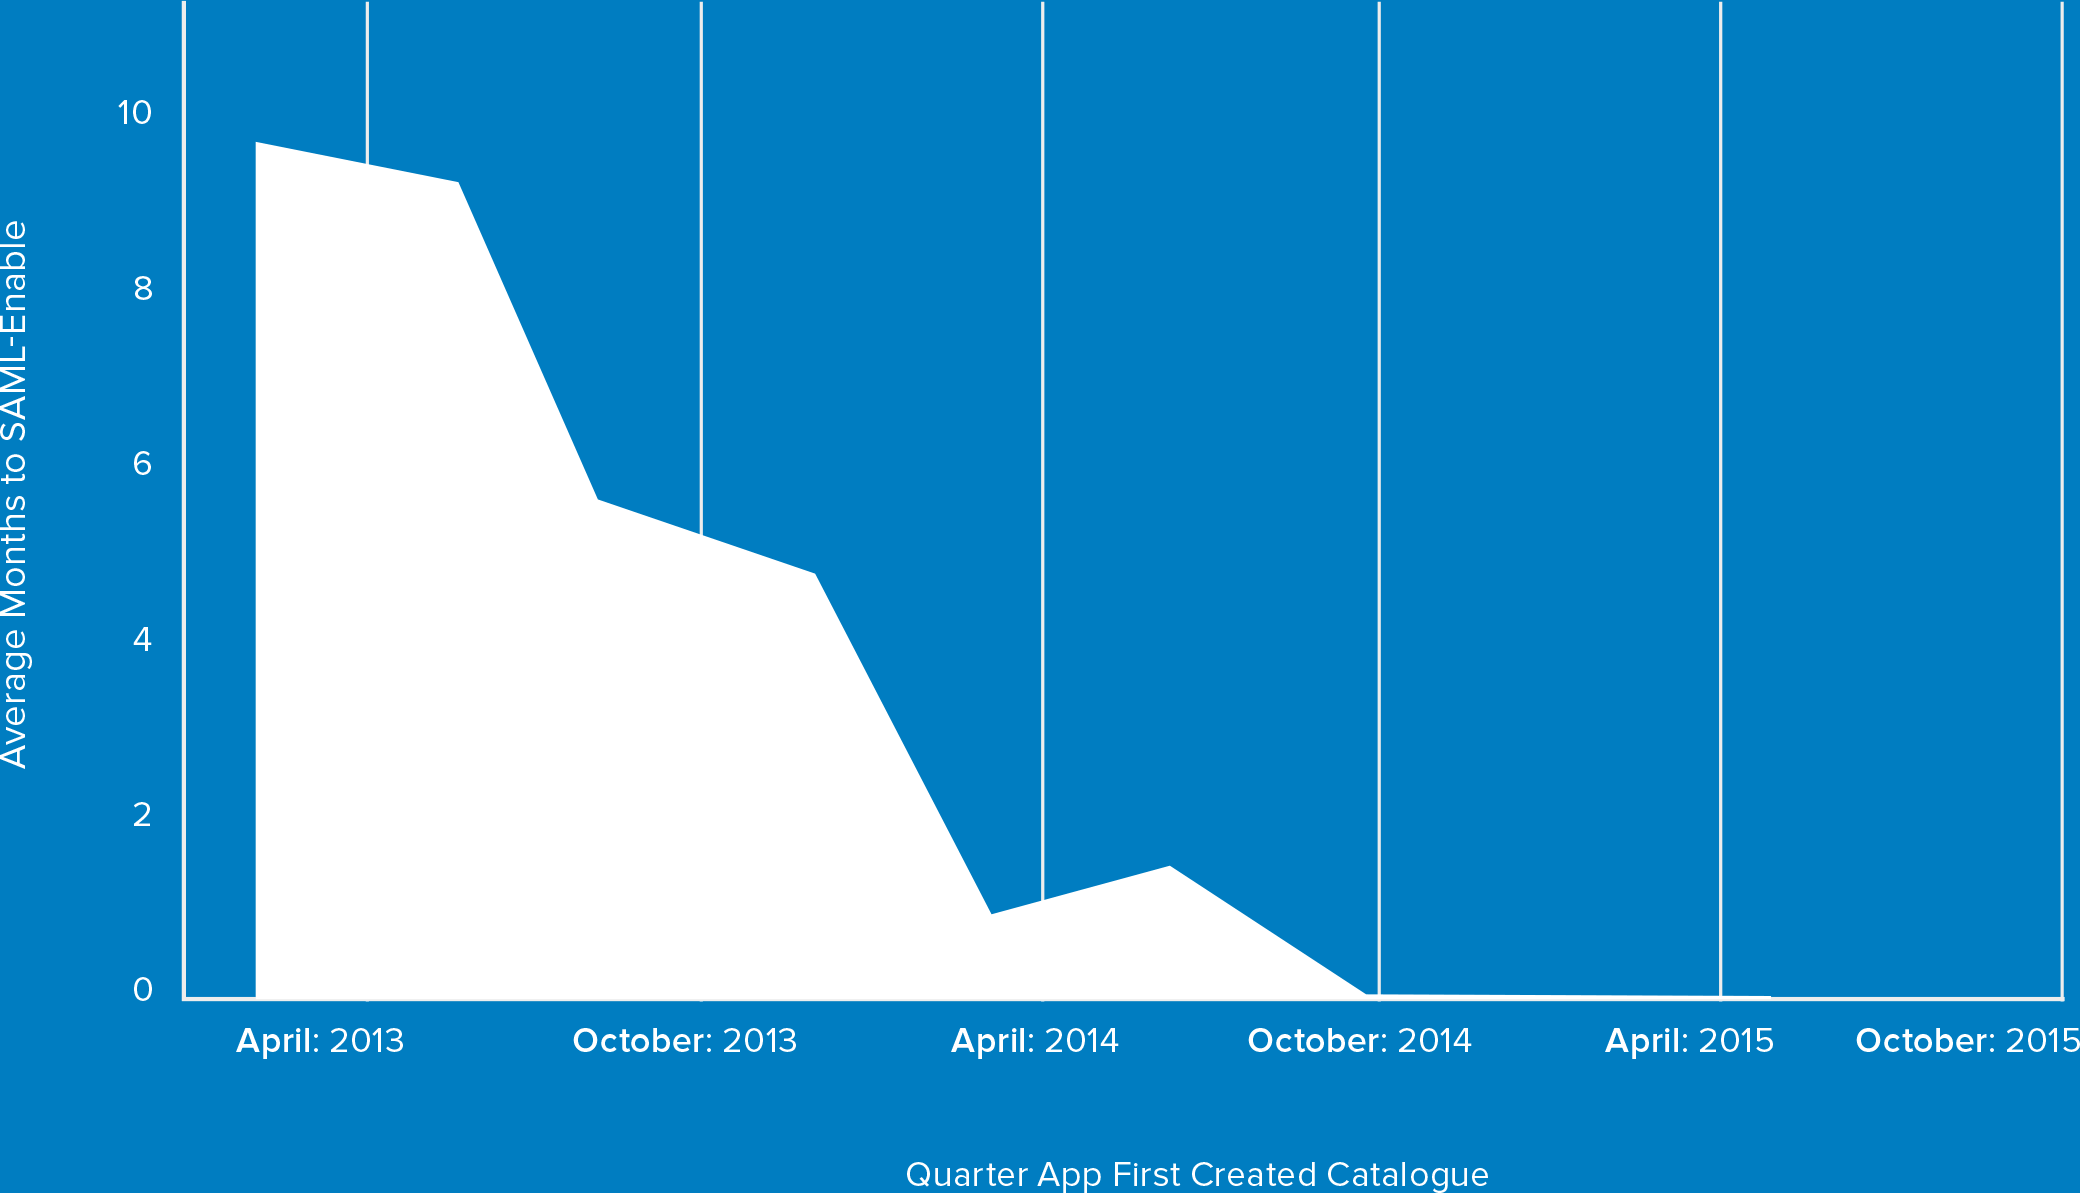
In the past, it took months for applications to become SAML-enabled. Our dataset shows that in the past two years, an increasing percentage of businesses applications—19 percent—entered Okta’s Application Network as SAML-enabled from the start. In addition, the average months to enable an app once it’s in the catalog has dropped to under a month. Enterprises and customers are making the request of ISVs to use SAML because it is a far more secure way of authenticating users. What’s more, it’s becoming easier because of cloud services are leveraging software to automate key exchanges, key management and new libraries that developers can drop into their apps.
Time to SAML-Enabled Apps
Percentage of New Apps That Were SAML-Enabled from The Start
Since 2014, Okta's external identities grew at 284 percent while internal identities grew at 192 percent.
What does the growth trend look like for businesses moving identities to the cloud for their partners, customers and contractors?
Since Okta started connecting people to technology in 2009, we’ve tracked the number of identities that business put in the cloud. In the past few years, Okta has also started to provide identity management for partners, customers and contractors. Since July 2014, external identities grew 284 percent while our internal identities grew 192 percent. While there are many factors contributing to this growth, we believe that business demand to secure and protect identities of outside constituents, is a major factor driving this trend.
Conclusion
As software continues to eat the world, we’re seeing organizations of all sizes hungry to adopt the apps and services that will make them successful. But creators of those apps and services will have to stay hungry too. The rapid rise and fall of enterprise apps in our dataset shows that enterprise developers apps must stay highly valuable to stay relevant, similar to consumer app adoption trends.
Organizations of all sizes are also adding necessary security layers that will protect their constituents, and their most sensitive and valuable information. The move away from the security question as a form of verification, and the adoption of multi-factor authentication is a sign that in the wake of countless breaches, companies value additional layers of security more than ever before. Organizations have also moved from just “protecting the house” to protecting the field as well, as Okta sees a rapid demand from business to manage and secure external identities in the cloud.
The results are in and the verdict is clear: it’s business time for cloud and mobile.
Have questions on Okta’s Businesses @ Work Report? Feel free to tweet questions with the hashtag #BusinessesAtWork or @Okta.
Appendix
Below, we’ve provided some specific methodologies for complex data points that refer to each graph.
Fastest Growing Apps:
The Fastest Growing Apps By Rank graph shows the change in rank of each app over time based on Okta’s number of customers that make that app available to their constituents. The Fastest Growing Apps Over Time graph shows the growth in number of customers who make the app available to their constituents over time.
Time to Enable SAML Apps:
This chart demonstrates that two years ago, apps that were created in Okta’s OAN took about 10 months to be updated in the catalog with SAML, now, almost all enter the catalog SAML enabled, or are SAML enabled in under a month.
Office 365 Heat Map:
Many of Okta’s customers use both Office 365 and Google Apps. In this graph, for any given breakout, the number of customers that have Google Apps minus the number of customers that have Office 365 divided by the total number of customers that have either app. We’ve neutralized the customers using both Google and Office 365.