




Key takeaways
Deploying AI coding tools increases individual engineer motivation and skills, but it doesn’t automatically boost engineering throughput (pull requests, lines of code, or pull request cycle time).
Enterprise bottlenecks persist because communication, waiting on decisions and dependencies, processes, and infrastructure account for more than half of engineers’ work time.
Closing the efficiency-throughput gap requires more than deploying tools. It takes deliberate effort to upskill engineers and reinvent teams, processes, and infrastructure.
When Okta rolled out GitHub Copilot to engineers in the second half of 2024, expectations were high. The industry narrative promised instant productivity gains. We found that engineers felt the difference: motivation went up, perceived skills improved, and boilerplate coding and testing became easier. Yet, when we measured the organizational output, monthly pull requests, lines of code, and cycle time per engineer didn’t change significantly.
Why did individual efficiency not instantly translate into higher organizational throughput?
The findings below are based on research we recently published in Communications of the ACM, “Beyond the Hype: The Efficiency-Throughput Gap with GitHub Copilot,” where we examined what happens when enterprise engineering teams adopt AI tools at scale.
Organizational Ohm’s Law
Five years ago, we started looking closely at engineering productivity, a field with more than half a century of history that has produced foundational ideas such as Fred Brooks’s “The Mythical Man-Month” and Conway’s Law. Brooks’s core insight is that you cannot build software faster simply by adding more engineers. Conway’s Law states that the software an organization builds tends to mirror its own communication structure.
At the heart of both, and much of what followed, is what we think of as a parallel-and-series problem: most software work depends on other people’s work, which limits how much of it you can run in parallel.
That insight led us to propose Organizational Ohm’s Law. In this framework, engineering productivity behaves like current, proportional to an engineer’s individual potential (motivation and skills) and inversely proportional to organizational resistance. That resistance comes from the engineer’s core work, such as coding, as well as collaboration, process, and infrastructure.
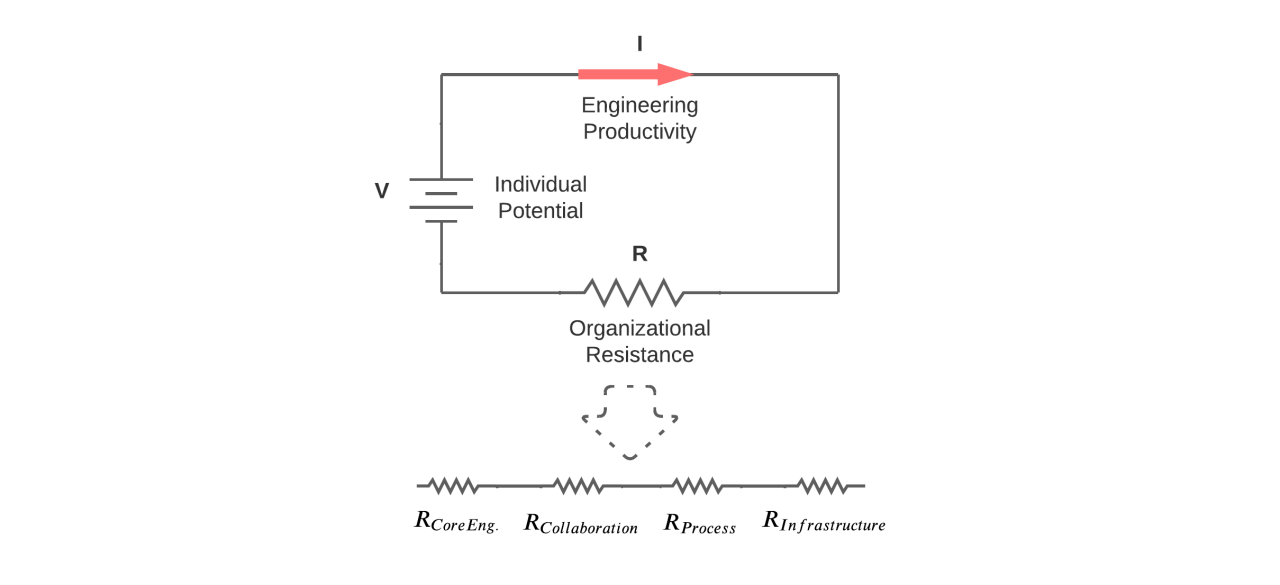 Organizational Ohm’s Law: Resistance components sit in series, and AI tools reduce only the core engineering one directly.
When Okta started adopting AI tools like GitHub Copilot in the second half of 2024, we had a practical question: what engineering productivity and business impact could we expect? The rollout gave us a real-world setting to test that question with Organizational Ohm’s Law.
Individual efficiency gains and organizational throughput bottlenecks
We surveyed engineers before and after they got Copilot, asking how they allocated their time, how motivated they felt, and how skilled they rated themselves. Then we paired those answers with actual Copilot usage and objective engineering metrics: pull requests, lines of code, cycle time, and review activity.
The individual results were positive. Motivation went up. Perceived skills went up. Engineers reported spending less time on coding and testing, and average weekly work hours dropped as well. People felt Copilot helped, especially with boilerplate, tests, and configuration.
However, on the engineering output side, monthly pull requests, lines of code, and cycle time per engineer did not change significantly. The savings landed in coding and testing, but the time engineers spent on communication, waiting on decisions and dependencies, processes, and infrastructure stayed the same, accounting for more than half of their work time.
Three stages of AI impact
To make sense of that gap between individual efficiency and enterprise throughput, we consider AI’s impact across three stages:
Stage 1: Efficiency gain (individual level)
- Status: Tools like standard AI assistants reduce time spent on boilerplate coding and testing. Our 2024 data sits in Stage 1.
- Impact: Engineers report feeling more motivated and skilled, but the organization’s output does not change.
Stage 2: Productivity gain (workflow level)
- Status: Upskilling engineers and redesigning workflows to align with AI-augmented capabilities.
- Impact: Noticeable increases in engineering output.
Stage 3: Organizational optimization (system level)
- Status: Redesigning the organizational structure to lower human-centric resistance, including exploring effective modes of human-AI teaming.
- Impact: More autonomous teams with increased individual scope, reducing the overhead from communication and decision-making.
From coding assistants to coding agents
We continued monitoring engineering metrics after the study closed, as our tools expanded from AI assistants to agents, with the Claude Code rollout in early 2026. What follows is a preliminary look at the impact of agentic coding tools, based on ongoing monitoring of our largest and most active repository. The rest of the definitions and methodology are unchanged.
Over the roughly 18-month period of AI-assisted coding with Copilot, pull requests, lines of code, and cycle time per engineer did not improve relative to our pre-Copilot baseline. Time alone did not improve the metrics.
We compared the three months before the Claude Code rollout (November 2025 through January 2026) with the three months after (April through June 2026), excluding the active rollout window in February and March:
- Monthly pull requests per engineer rose by 37% among the 295 engineers who contributed in both periods
- Average pull request cycle time shortened by 16%, and the longest-running pull requests closed even faster
- Lines of code per engineer rose 90%, and that increase was uneven: 55% for production code and 115% for test code
| Metric (per engineer) | GitHub Copilot rollout (Apr-Jun 2024 vs Sep-Nov 2024) | Claude Code rollout (Nov 2025-Jan 2026 vs Apr-Jun 2026) |
|---|---|---|
| Engineers included | 74 survey participants | 295 repository contributors |
| Monthly pull requests | No significant change | 37% increase |
| Monthly lines of code | No significant change | 90% increase (55% production, 115% test) |
| Average pull request cycle time | No significant change | 16% faster |
| Motivation and skills | Significant improvement | Not measured |
The two comparisons draw on different populations: Survey participants across all repositories in 2024, and contributors to our largest repository in 2026. Each is a before-and-after comparison of the same engineers.
However, these are measures of code produced, not of the quality and value we shipped. AI tools may change how much code a given piece of delivered value takes, whether through more tests written alongside each change, more rework, or different habits. If so, pull requests, lines of code, and cycle time no longer mean quite what they used to. The metrics alone cannot show how engineers’ coding behavior has actually changed, or how much of the change was due to Claude Code. These need more study before the picture is complete.
We also excluded agent-authored pull requests from these numbers. As more coding agents are deployed in production, how they work with humans and how they change software development are interesting directions for future study.
Closing the gap takes more than better tools
We are optimistic about AI tools. The individual engineer benefits we measured in 2024 were real, and the tools our engineers use now are considerably more capable than those we studied. But the gap between the benefits engineers experience individually and what shows up in organizational output has not closed. If anything, it has widened.
What these tools can do for an individual engineer has grown enormously since we ran our study. Our organizational engineering metrics have not moved anywhere near that far. Closing that gap is not something better technology will do on its own. It takes a co-invention of the tools, the team, the process, and the infrastructure, all evolving together.
If you want to measure this at your own organization, we built the underlying methodology to be lightweight so that any engineering organization could run it alongside a real rollout or monitoring without disrupting the team, pairing a short survey with metrics you likely already collect. If you try something similar at your company or see a similar gap, we would like to hear about it.
Read the complete study
To dive deeper into the dataset, statistical analysis, and our Organizational Ohm’s Law model, read our research paper, “Beyond the Hype: The Efficiency-Throughput Gap with GitHub Copilot,” published in Communications of the ACM (October 2026) on the ACM Digital Library.


