

Customer Identity Trends Report
Based on a survey of more than 20,000 consumers across 14 countries, this report examines customer attitudes toward convenience, privacy, and security — and the implications for brands.

Delivering great digital experiences is the name of the game.
But meeting customer expectations is easier said than done.
Let’s find out why …

More accounts. More problems.
Regardless of region, most consumers maintain 10 to 20 active accounts at any one time. The emphasis here is on “active” — consumers likely have many unmaintained accounts that create security risks and contribute to account churn.
By the numbers
As digital transactions continue to play a larger role in our lives, the number of accounts we need to manage grows too.
of consumers have 10 or more active accounts
have 20 or more — led by Europe, with 39%

“Brands are learning that their visitors want the company-to-consumer relationship to develop much like personal relationships develop in real life, through a series of trusted and delightful interactions.”
Kerry Ok
Senior Vice President, Marketing
Okta

The hidden costs of passwords
Consumers will spend more when they encounter less friction, like passwords, during the login process. This holds true across industries and regions.
By the numbers
Nothing causes more friction than passwords, and so trouble starts the moment customers set up an account.
of consumers find creating passwords that meet certain requirements frustrating
of consumers report that at least once a month they’re unable to log in to an account because they forgot their username or password
Consumers value control over convenience
Customers want personalized experiences, but they also want control over their information. When asked to choose between the two, consumers favored maintaining control — especially for transactions in financial services and insurance, healthcare, and the public sector.
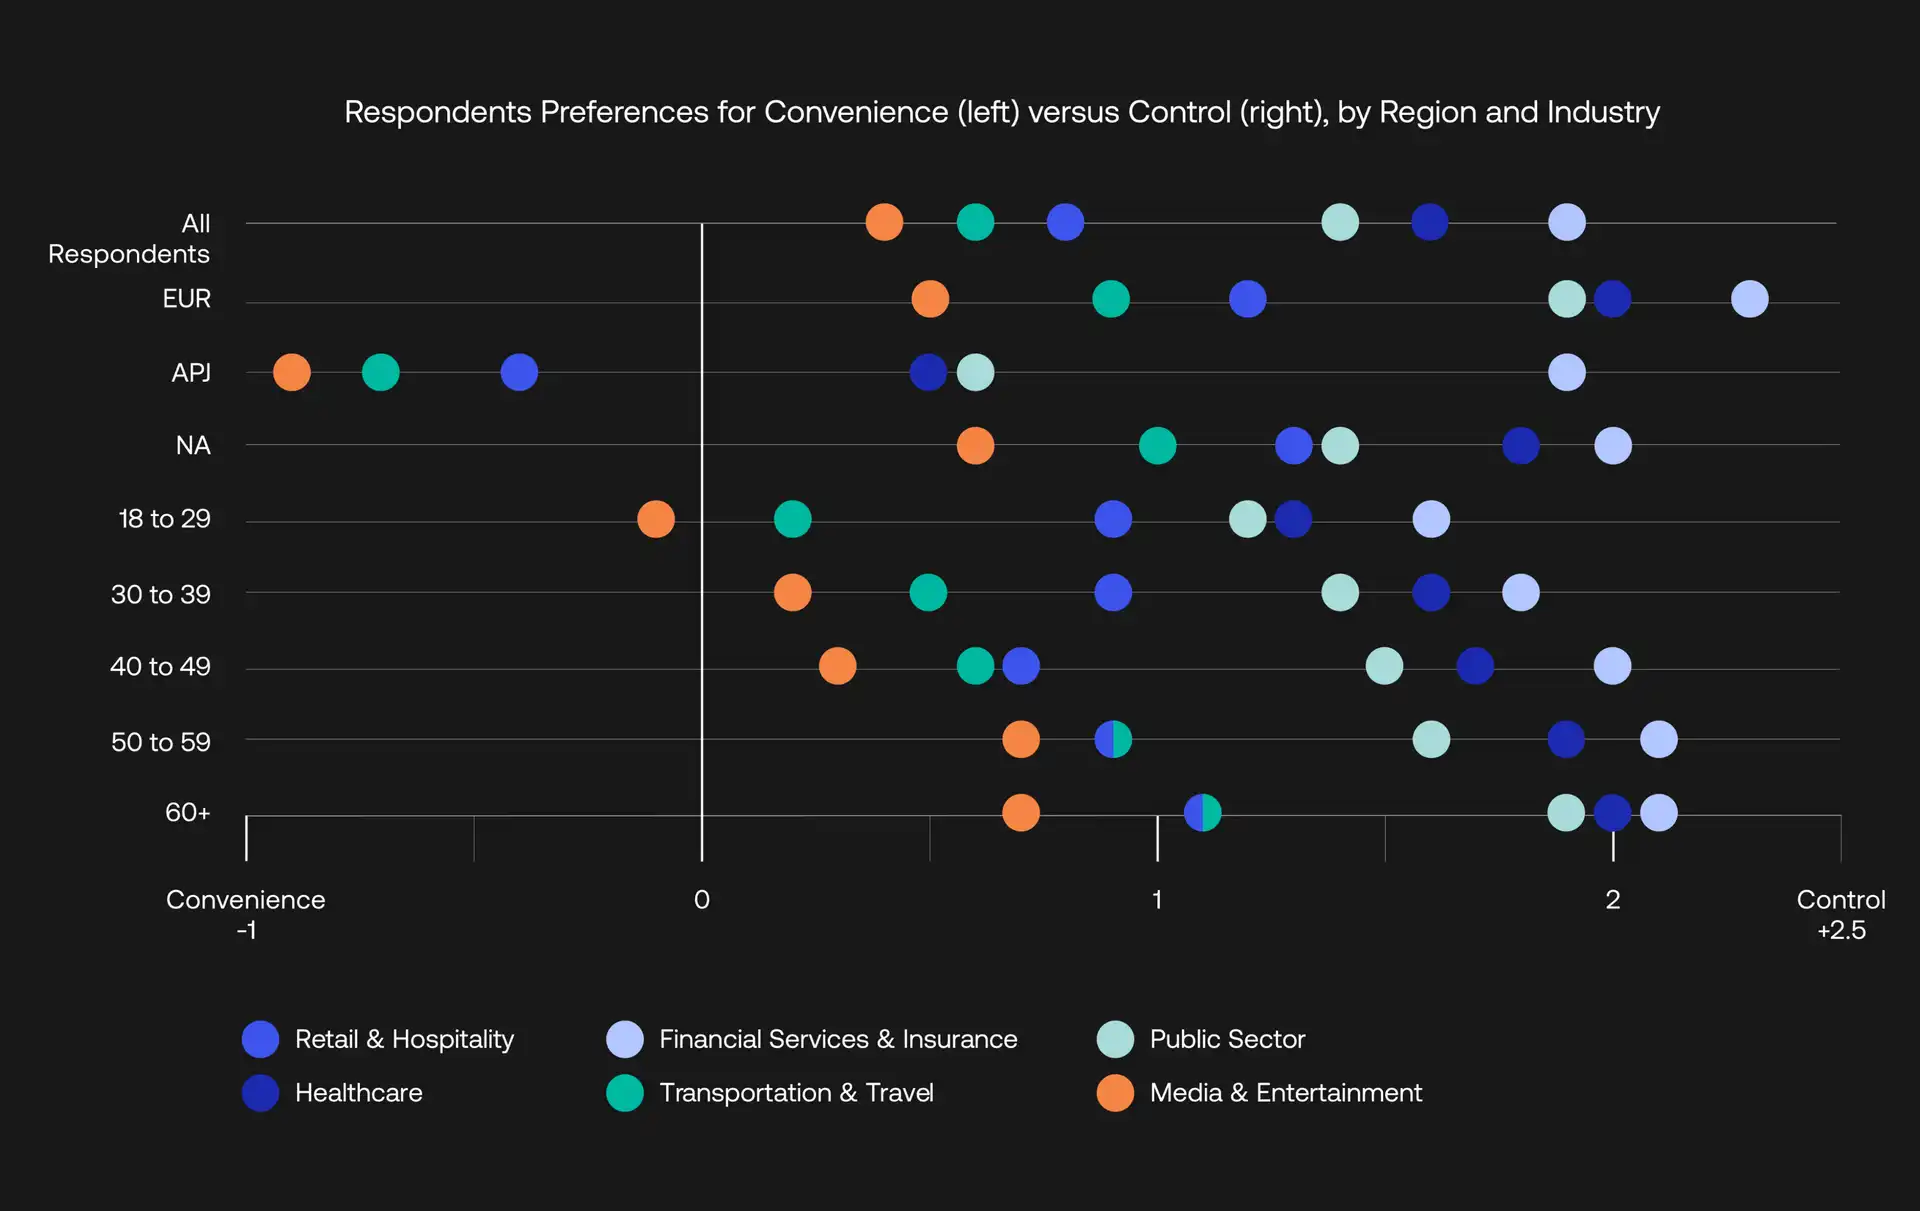
Figure 9: Composite score based on respondents' preferences for a frictionless user experience versus maintaining control over their data. Higher numbers on the five-point scale indicate a preference for control; lower numbers indicate a preference for convenience.

Dive in
Discover how your customers are thinking about Identity and optimize your digital experiences.