
The most popular apps of 2019
We welcome some apps to the spotlight for the first time. Lucidchart and GitHub join the top 15 most popular apps by number of customers. In popularity by active unique users, Zoom and UltiPro join the ranks of top apps, and G Suite pushes ahead of Salesforce. In both our popularity rankings (by number of customers and number of users), Office 365 takes the lead and G Suite comes in fourth. G Suite shows slightly faster year-over-year growth, increasing its number of customers by 37%, versus Office 365’s 36% customer growth. Looking at active unique users, G Suite’s year-over-year growth stands out at 50%, while Office 365 has experienced 38% user growth.
The fastest growing apps
Our fastest growing apps and integrations feature six data- or security-focused tools which are new to the top ranks: Snowflake, Atlassian Opsgenie, Google Cloud Platform, Splunk, Looker, and Envoy. Snowflake lands at the top of the heap with a whopping 273% growth year over year. And video conferencing favorite Zoom sets some new records.
In a special update, we also look at whether or not being a fastest growing app correlates to a company’s success. Our #1 fastest growing over the past five years — Slack (a double winner), Zoom, Jamf, and KnowBe4 — have all gone on to do big things, securing growth equity or going public.
Happiness with app-iness
Demand for app diversity continues to grow. This year, the average number of apps per customer reached 88, up from 83 apps a year ago. And now 10% of our customers deploy a substantial 200 apps or more.
We also looked at whether deploying Office 365 means customers commit to an exclusively Microsoft environment. The answer is increasingly “no”: the overlap of companies that deploy Office 365 but also invest in best-of-breed apps continues to grow. This year, nearly 78% of Okta’s Office 365 customers have adopted one or more best-of-breed apps. 32% deploy Zoom and 31% deploy Slack, in addition to Office 365. Customers increasingly invest in multiple bundles: over 30% of Okta’s Office 365 customers now deploy G Suite as well.
App-idextrous: tools we use for work and play
We looked at the most popular developer tools, HR tools, and video conferencing deployments at the corporate level to see what companies select for their workforces. The Atlassian Product Suite is the clear choice of developers; HR teams are still choosing Workday, but BambooHR has moved up to the second spot; and Zoom blows away the video conferencing space.
We also like to see what tools users choose to integrate into their daily lives, whether paying bills, planning trips, taking online classes, or donating to charitable causes. For this, we expand our scope to include apps that employees adopt as personal apps through Okta, in addition to those assigned by IT.* In the online learning space, Lynda.com content propels LinkedIn Learning to a strong first place. In the banking and finance realm, PayPal holds the top spot, growing in parallel with major banking institutions. Travelers are partial to the consolidated rewards programs that is now Marriott Bonvoy, but Airbnb checks in close behind. Uber still sets the pace for ground transportation. American Airlines has overtaken incumbent Southwest. And we see that travelers are increasingly turning to one-stop trip planning apps, such as TripIt and Expedia.
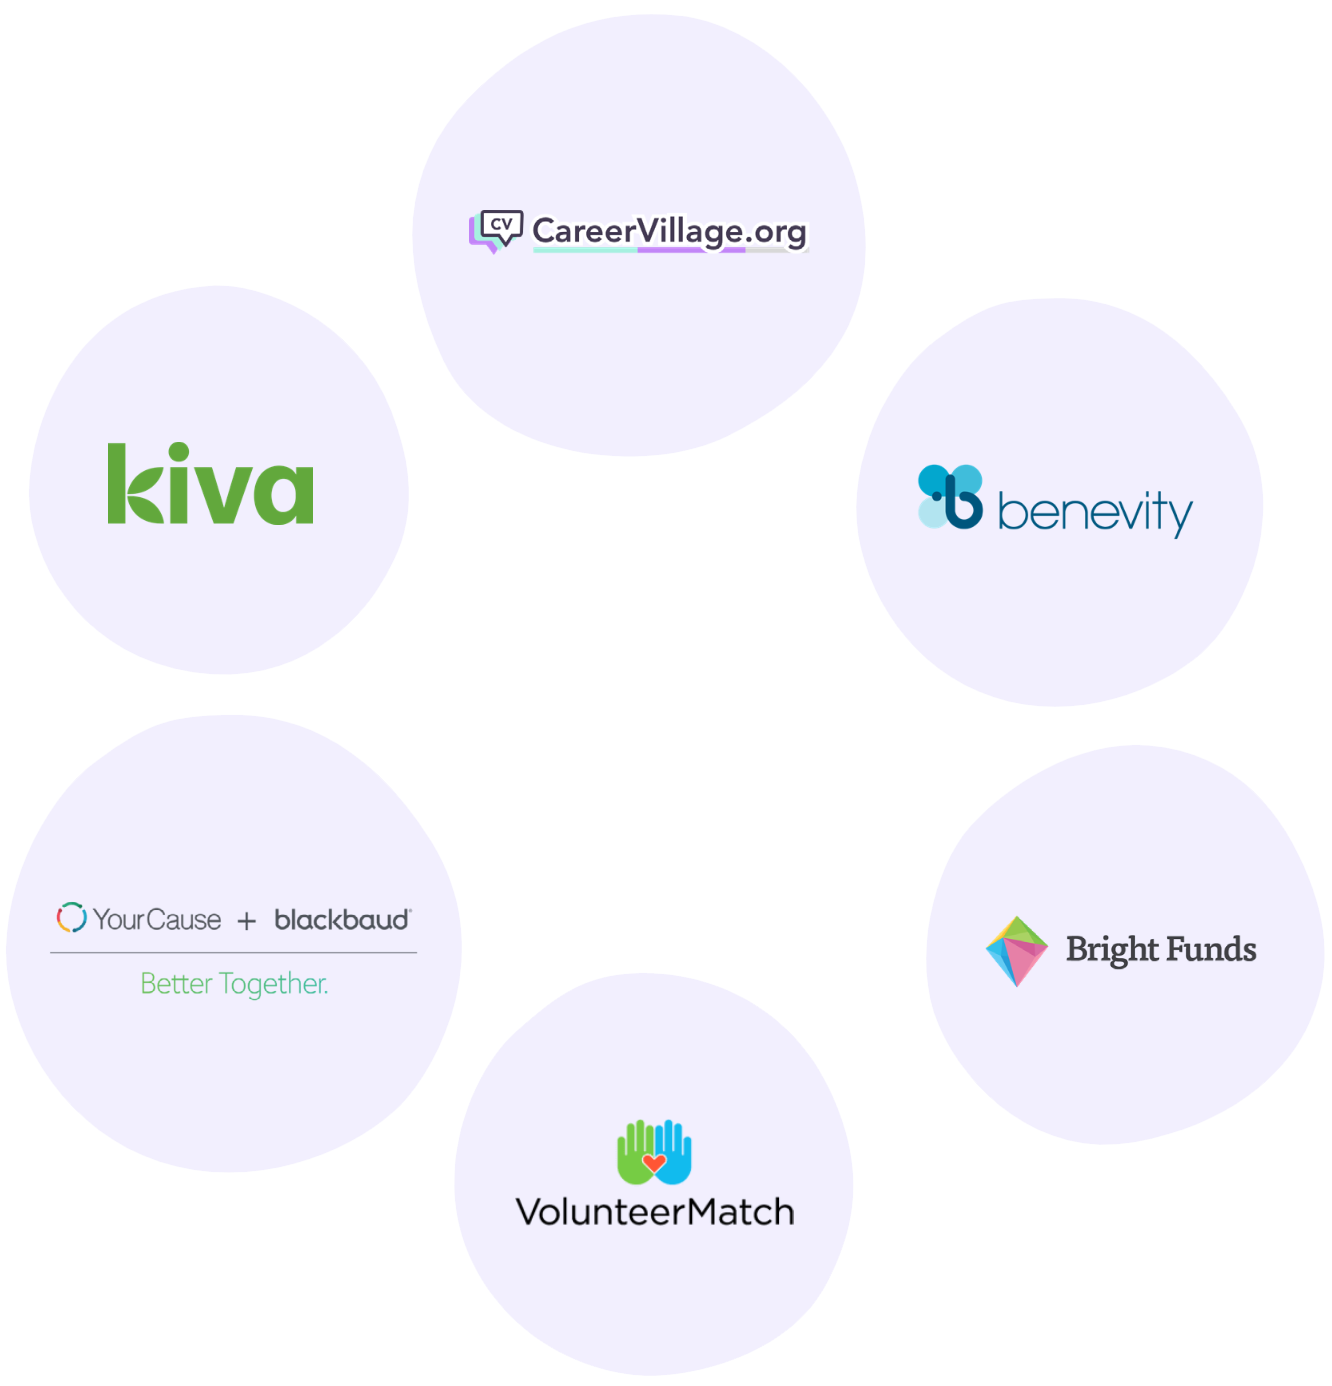
When it comes to social impact solutions, CareerVillage is currently the most popular App for Good among Okta customers, followed by Kiva. Customers also deploy Benevity, YourCause, BrightFunds, and VolunteerMatch.
* Consistent with the rest of our Businesses @ Work report, all data is anonymized.
Not your grandmother’s security stack
Security teams are adjusting to changing dynamics in the IT and threat landscapes. Companies are increasing their investments in security tools across the board. Looking at our network, we see companies deploying over 150 unique tools that we identify as security-focused. We divide these tools into a “modern security stack,” with four strategic layers, defined by what the tools are designed to protect: 1) people, 2) devices, 3) infrastructure, and 4) network. When customers adopt their first security tool, more than one third start with a tool from the people layer. Within the people layer, the fastest growth is coming from password managers, at 84% year-over-year growth. But overall, the infrastructure layer is seeing the fastest year-over-year growth, at 61%. The two most-adopted security tools — KnowBe4 and Mimecast — focus on email security against phishing attacks.
Factor check: newer customers want fewer, stronger factors
Customers are deploying multiple factors in addition to, or instead of, passwords. Use of Okta Verify (including Okta Verify with Push notifications) is on the rise, from 70% two years ago to 78% today. SMS and security questions are on the decline. For the first time since we’ve tracked factor deployment, we see a downward shift in the distribution of the number of factors deployed. We dug into the data to discover that the migration toward fewer factors is being significantly driven by newer customers — those that have been using Okta for less than one year. Of these newer customers, 39% deploy only one factor, but it tends to be a more secure factor: 71% are deploying Okta Verify. Newer customers deploy a simpler, stronger factor experience.
The MVPs of SDKs
C# and Java rank as the most popular tools used to build customer identity solutions. In a recent poll of over 100 of our customers, 89% reported they are currently building custom apps, and 81% report having an internal team that works on application development.
How did Okta create this report?
To create our Businesses @ Work reports, we use anonymized Okta customer data from our network of thousands of companies, applications, and IT infrastructure integrations, and millions of daily authentications and verifications from countries around the world. Our customers and their employees, contractors, partners, and customers use Okta to log in to devices, apps and services, and leverage security features to protect their sensitive data. Our customers span every major industry and vary in size, from small businesses to enterprises with hundreds of thousands of employees or millions of customers. As you read this report, keep in mind that this data is representative of Okta's customers, the applications we connect to through the Okta Integration Network, and the ways in which users access these tools through our service.
We have worked carefully to standardize our data. Unless otherwise noted, this report presents and analyzes data from November 1, 2018 to October 31, 2019, which we refer to as “this year,” “today,” and “in 2019.” Similarly, when we refer to “last year” or “in 2018,” we are referring to data from November 1, 2017 to October 31, 2018. “2017” refers to the same period in its respective year.
Unless otherwise specified, the data included in this report is limited to Okta customers that have deployed at least one app through the Okta Integration Network. Also, unless otherwise noted (see App-idextrous: tools we use for work and play), this report looks at apps deployed for corporate use.
Each year, we look at app popularity two different ways: first, by number of customers with an app deployed, and second by the number of active unique users, defined as users who have logged into an app via Okta at least one time in the past 30 days.

Roll out the red carpet, here come the stars
We’d like to welcome some rising stars to center stage this year. Lucidchart and GitHub both secure “top 15” spots on the most popular apps by number of customers for the first time. And after ranking well as an HR tool in previous years, the human capital management app UltiPro makes it onto the most popular apps by active unique users for the first time. Congratulations, and enjoy the spotlight!
Most Popular Apps by Number of Monthly Active Unique Users

Data and security tools join the VIP list
Our fastest growing apps and integrations feature six data- or security-focused tools, which are new to the top ranks: Snowflake, Atlassian Opsgenie, Google Cloud Platform, Splunk, Looker, and Envoy.
This year’s fastest growing apps show us that apps tend to grow in category waves. A few years ago the #1 fastest growing apps — Slack and Zoom — focused on collaboration. Winners from the past two years were security-focused Jamf Pro and KnowBe4.
This year, we’re seeing data tools grow quickly. Data warehousing provider Snowflake lands at the top of the heap this year with a whopping 273% growth year over year. This was a big year of “firsts” for Snowflake — they were also named a Leader in the Gartner Magic Quadrant for Data Management Solutions for Analytics.1 And the data party is raging: big-data cruncher Splunk joins the list for the first time at #4, while Looker, a data discovery tool acquired by Google Cloud, jumps into sixth position.
Just as we’ve seen developer tools jump up in our most popular apps, we also see a developer tool join the list of fastest growing. Atlassian Opsgenie, an incident management solution acquired in 2018 by Atlassian, bursts into second place.
Companies continue to prioritize building their security stacks. On-site visitor management company Envoy walks in the door at #8. KnowBe4, the #1 fastest growing app in 2018 (and #3 in 2017), still shows a respectable 89% growth year over year. And Jamf Pro still ranks as a fastest growing app two years after its #1 ranking in 2017. These apps are featured in our modern security stack section as well.
And while Amazon Web Services (AWS) is the third most popular integration by number of customers, Google Cloud Platform is coming up strong with 108% year-over-year growth. Does this mean our customers are embracing multi-cloud? We looked into the data. While a third of customers are deploying AWS, Azure, or Google Cloud Platform, roughly 5% of customers are choosing to integrate more than one Infrastructure as a Service (IaaS) provider with Okta, up from 4% the previous year. The forecast is multi-cloudy!
Collaboration may no longer be the belle of the fastest growing apps ball, but it’s still on companies’ minds. We give a special nod to Zoom, the only app we’ve seen in the top ten fastest growing for a remarkable four years in a row, originally premiering at #1 in 2016. Zoom also earns the rare distinction of being a top app by number of customers, a top app by active unique users, and a fastest-growing app, all at once. Folks, we’re seeing a world record first for both achievements!
1. Gartner “Magic Quadrant for Data Management Analytics Solutions” by Adam Ronthal, Roxane Edjlali, Rick Greenwald, January 21, 2019.
Looking for the next success story? Take a peek into our crystal ball.
Top apps deserve awards, parties, balloons, and streamers. But what happens to top apps after the music dies down? Where are they now, outside the world of our data? Has our fastest growing list predicted successful companies? The answer is a resounding yes! Our #1 fastest growing apps have all gone on to do big things.
We wanted to understand what’s going on behind the huge growth spurts that land companies on our fastest growing apps, including the winners’ financing situations. We compared our #1 fastest growing apps’ history against investment rounds and noticed that all of our top apps had completed their Series B or C rounds by the time they reached the top spot. While Slack and Zoom went on to additional funding rounds before finally going public in 2019, Jamf was acquired by Vista Equity Partners the month after appearing in the #1 spot, and KnowBe4 secured growth equity a few months after its appearance as last year’s fastest growing app.
Note: In the updates below, we refer to companies based on the year they achieved their #1 top ranking. For example, Zoom is considered the fastest growing app of 2016 because its data set ended in 2016, although its top app ranking was announced in the January 2017 report.
2014, 2015
![]()
In 2016, Slack exceeded 2.7 million daily active users, 800K of which were paid. In 2019, the company went public with a $23 billion valuation and in October 2019, Slack announced it had over 12 million active daily users.
2016
![]()
Zoom’s revenue grew 300% in 2016, and 150% in 2017. It was profitable in the third quarter of 2016. Zoom became the most valuable tech IPO of 2019 after it rallied 72% in its first day of trading. In fiscal year 2019, Zoom reported sales of $330.5 million with net income of $7.6 million.
2017
![]()
By 2017, Jamf had more than $110 million in total annual billings. In October 2017, it was acquired by Vista Equity Partners. In 2019, Jamf added 1,000 new customers a month.
2018
![]()
KnowBe4 raised a $300 million Series C led by KKR, which values KnowBe4 at $1 billion — making it a "unicorn." As of October 2019, KnowBe4 reached 55% year-over-year growth, increasing customer accounts to well over 28,000.
2019
![]()
Snowflake, we expect big things from you!

Demand for app diversity continues to grow
Over the years, we’ve seen app adoption steadily rise, across all industries and company sizes. This year, the average number of apps per customer reached 88: that’s a 6% increase from 83 apps a year ago, and a 21% increase from 72 apps three years ago. And now 10% of our customers deploy a substantial 200 apps or more. When we look at customers that have been with Okta for more than four years, they deploy an average of 190 apps.
Average Number of Apps per Customer
Note: Data includes Okta Integration Network (OIN) and non-OIN, personal and corporate apps.
Okta's Office 365 Customers with Best-of-Breed Apps over Time
- Salesforce
- AWS
- Box
- G-Suite
- Slack
- Zoom
Note: Salesforce data for 2017 and 2018 are the same at the time of the report, as are 2016 and 2019.
Okta Customers with Office 365 and Best-of-Breed Apps
- Number of Best-of-Breed Apps
-
0 Apps
-
1 App
-
2 Apps
-
3 Apps
-
4 Apps
-
5 Apps
-
6 Apps
This year, nearly 78% of Okta’s Office 365 customers have adopted one or more of these best-of-breed apps, an increase from 76% last year. We see that 3.2% of Okta’s Office 365 customers are using all six best-of-breed apps, compared to only 2.4% last year. It’s clear our customers are prioritizing functionality and employee needs over bundling.

The most popular apps by category
Each year, we dig into our data to look at app popularity by category. This year, we look at developer tools, HR tools, and video conferencing apps to see what companies select for their workforces. For these categories we only look at apps that have been deployed to the company by their IT team.
We also like to see what tools users choose to integrate into their daily lives, whether they are paying bills, planning trips, taking online classes, or donating to charitable causes. For this, we expand our scope to include apps that employees adopt as personal apps through Okta, in addition to those assigned by IT.*
*Consistent with the rest of our Businesses @ Work report, all data is anonymized.
It’s just business: apps deployed by organizations
Most Popular Online Learning Apps
Note: Data includes both personal and corporate apps.
Most Popular Banking and Finance Apps
Note: Data includes both personal and corporate apps.
Most Popular Hotel and Lodging Apps
Note: Data includes both personal and corporate apps.
Most Popular Airline Apps
Note: Data includes both personal and corporate apps.
Most Popular Ground Transportation Apps
Note: Data includes both personal and corporate apps.
Most Popular Travel Planning Apps
Note: Data includes both personal and corporate apps.
Our business travelers are increasingly turning to one-stop trip planning apps. Over the last three years, TripIt and Expedia have steadily beat out competitors, with TripIt pulling sharply into the lead. Corporate travel management provider Egencia, part of the Expedia Group, is also showing steady growth that has elevated it to the #3 spot.
Companies are baking Apps for Good into their social impact strategies
When people support charitable causes, everyone wins. A recent study shows that 75% of people who volunteered in the past year reported that volunteering made them feel physically healthier. And, more companies are supporting employees’ volunteerism. According to a Deloitte study, 89% of working Americans believe that companies that sponsor volunteer activities offer a better overall working environment than those that do not. In fact, 70% of respondents say that volunteer activities are more likely to boost employee morale than company-sponsored happy hours.
Apps for Good is a new ecosystem in the Okta Integration Network designed to help companies harness and turbocharge employees’ charitable spirit. These integrations make it easier than ever for companies and employees to donate time, money, expertise, and more.
When looking at apps deployed for both corporate and personal use, CareerVillage is currently the most popular App for Good, followed by Kiva. Customers are also deploying Benevity, YourCause, BrightFunds, and VolunteerMatch.

Security teams are protecting the new perimeter: their people
The security landscape is changing rapidly. From an IT perspective, it’s a cloud and mobile world, and the traditional perimeter is gone: people are the new perimeter. The threat landscape is changing as well. Attackers are increasingly targeting users and their credentials to gain unauthorized access to accounts. Security teams are adjusting to these dynamics, increasing their investments in security tools and prioritizing the protection of their people first.
According to IDC, “worldwide spending on security-related hardware, software, and services is forecasted to reach $106.6 billion in 2019, an increase of 10.7% over 2018."5 This pace of growth is expected to continue for the next several years as companies attempt to armor themselves against increasing — and increasingly costly — attacks. The 2019 report from the Ponemon Institute estimates the total cost to an attacked organization averages $13 million, up 72% over the past five years.
Our customers are at the front of the security parade. We see an increase in the deployment of security tools across the board, with the largest focus on tools that protect people.
5. IDC, Worldwide Semiannual Security Spending Guide, 2018-2022, October 2019.
The four strategic layers of the modern security stack
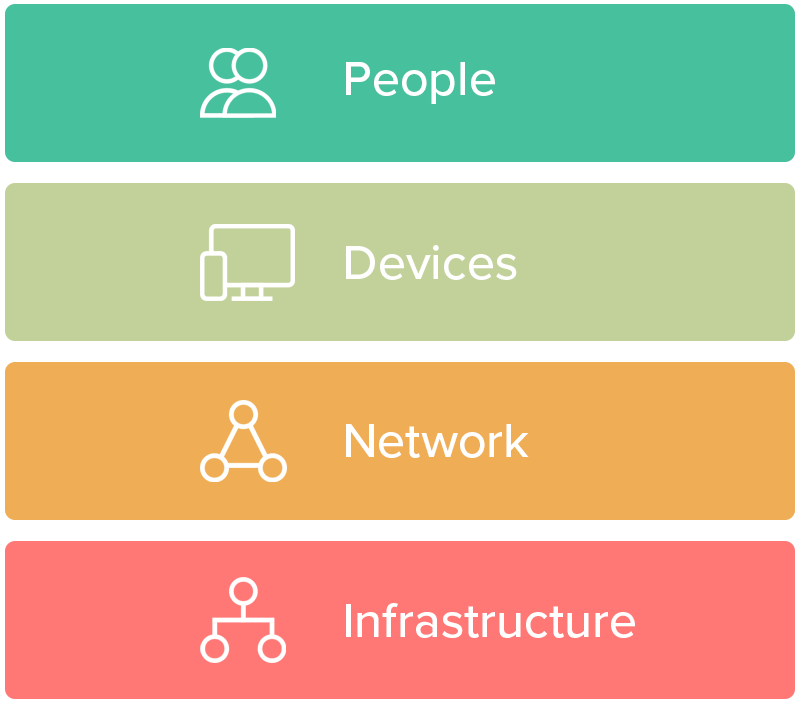
Looking at our network, companies deploy over 150 security-focused tools. An analysis of our data over the past four years shows that there is a new “modern security stack.” We’ve broken that stack into four layers of security, protecting: 1) people, 2) devices, 3) network, and 4) infrastructure.
PEOPLE: Tools that protect people focus predominantly on accounts and credentials, but physical security solutions are also widely adopted. The people layer includes email security and password management, ID proofing, privileged access management (PAM), identity governance and administration (IGA), cloud access security brokers (CASB), as well as on-site visitor management tools.
DEVICES: In the devices layer, we include tools for security analytics, endpoint management and security, and certificate management.
NETWORK: The network layer of the security stack includes secure web gateway tools, VPNs and firewalls, and proxies.
INFRASTRUCTURE: In the infrastructure layer, we include content delivery network providers, server access, and infrastructure monitoring tools.
After reading the stats above about credential-based attacks, it should be no surprise that our two most-adopted security tools — KnowBe4 and Mimecast — focus on securing email against phishing attacks. KnowBe4, Jamf Pro, and Envoy are also among our fastest growing apps this year based on year-over-year adoption.
What are the top security tools across the board? If you were to build a modern security stack based on the most popular tool in each security layer, this is what it would look like:
- People: KnowBe4
- Devices: Jamf Pro
- Network: Palo Alto Networks Prisma Access (formerly GlobalProtect)
- Infrastructure: New Relic
Digging in to the device layer a bit more, we investigated usage data and saw some different patterns. With Okta Device Trust, our partner platforms have deep insight and visibility into the type and state of device from which a user is accessing applications. We’ve built integrations to and with leading unified endpoint management platforms to help unify these device signals into authentication requests. VMware’s Workspace ONE platform leads these integrations, representing more than 50% of connections to the Okta platform. Customers have more options than ever before to secure their user and device population, and the breadth of implementations in this section shows that a unifying platform helps that journey.
Apps and tools from all four security layers show substantial increases in adoption. The top apps are coming within striking distance of our most popular apps by number of customers. We look forward to seeing what develops next year.
Finally, we were curious: how large does a company generally get before it begins to take security concerns seriously? When looking at company size determined by the number of users assigned to apps in the Okta Integration Network, we found a clear delineation: customers tend to change their behavior when they have 150 users assigned to apps. Companies with 150 or more users are two times as likely to have a tool from the people layer or the device layer, and 2.4 times as likely to have a tool from the network layer, than those companies with less than 150 app users.

Most popular factors
People joke about passwords like “password,” but according to the UK’s National Cyber Security Centre, the most commonly hacked password — the password with 23 million victim accounts hacked worldwide — was (wait for it)... “123456.” (Don’t go patting yourself on the back for using “qwerty,” either: that’s number two). And in a recent survey by the Ponemon Institute, 69% of respondents admit to sharing passwords with their colleagues in the workplace to access accounts, and 55% do not use any form of two-factor authentication at work.
What’s at stake? An awful lot. The latest statistics put the average total cost of a data breach at $3.9 million, up slightly from last year. In 2019, on average, 25,575 records were compromised, and it took 279 days to identify and contain the breach.
In light of these statistics, we’re pleased that Okta customers are deploying multiple factors in addition to, or instead of, passwords. And new customers are choosing their factors carefully, opting for fewer but stronger factors.
Customers Authenticating with Each Factor
Note: Each data point includes customers with MFA authentications within the last 30 days.
Distribution of Number of Factors
Note: Data is limited to customers with MFA.
This year we noticed that, of Okta customers deploying a factor, nearly 26% deploy only one factor. One year ago, that number was 17%. Last year, the bulk of customers (54%) used two or three factors.
Companies could be responding to “factor sprawl” — having too many factors for IT to efficiently manage. Companies that use Multi-Factor Authentication (MFA) want to provide as many options as possible, but they need to ensure that MFA is user-friendly or it won’t work as intended. When companies allow for too many factors, employees may feel overwhelmed and might attempt to ignore requirements.
To understand the reduction in factor distribution, we wondered, do newer customers behave differently than older customers? We found that yes, in fact, they do.
New dogs learn one secure trick
We discovered that the migration toward fewer factors is being significantly driven by newer customers. We define newer customers as those who have been with Okta for less than one year. Of these newer customers, 39% deploy only one factor. In comparison, 17% of older customers — Okta customers for more than one year — have only one factor.
Across our network we see customers shifting toward more secure factors (app-generated codes, push authentication, and physical keys) and away from lower assurance factors like SMS and security questions. Newer customers are driving this trend. Among newer customers with one factor, 71% are deploying Okta Verify (including Okta Verify with Push). In contrast, 37% of older customers are deploying Okta Verify for two step verification.
The deployment of security questions has dropped by half. Our newer customers are truly deploying a simpler, stronger factor experience. This enables them to deploy better security without compromising the user experience, solving the dilemma of usability versus security.

Customers Using Each SDK Tool
Note: Data limited to customers with at least one SDK event between Jan 2018 and Oct 2019.
In addition to identity solutions for the workforce, we also offer customer identity solutions to help organizations build and scale seamless digital experiences for their customers. When looking across our customer base at organizations building these experiences, we see C# and Java rank as the most popular tools. C# is a language built on top of the .NET framework. The largest organizations in the world use .NET, indicating that these types of companies are leading the charge in buying a customer identity solution vs. building a homegrown solution. In a recent poll of over 100 of our customers, 89% reported they are currently building custom apps, and 81% report they have an internal team that works on application development. Newer SDKs like Go are also quickly being adopted, signaling newer, modern organizations are also buying customer identity solutions to keep their developers laser-focused on the core business and accelerating time to market of new apps.

The script is changing. Data management tools are taking center stage. Developer tools are moving out from the wings and into the spotlight. Security tools are like bouncers popping up at every door and window. App adoption is growing across the board as customers become best-of-breed apps’ biggest fans. Behind the scenes, users are relying on corporate and personal apps to get their jobs done. It’s a crowded stage for apps and tools, and the show has a long run ahead of it. We hope this report gives you an unobstructed view of the changing landscape.
2020 Businesses @ Work
Download PDF Businesses @ Work Dashboard
Businesses @ Work (From Home)
We published a mid-year update that looks at trends as organizations adapt to COVID-19.